Determine maximum growth rates by nonlinear fits for a series of experiments.
Usage
all_growthmodels(...)

# S3 method for class 'formula'
all_growthmodels(
  formula,
  data,
  p,
  lower = -Inf,
  upper = Inf,
  which = names(p),
  FUN = NULL,
  method = "Marq",
  transform = c("none", "log"),
  ...,
  subset = NULL,
  ncores = detectCores(logical = FALSE)
)

# S3 method for class '`function`'
all_growthmodels(
  FUN,
  p,
  data,
  grouping = NULL,
  time = "time",
  y = "value",
  lower = -Inf,
  upper = Inf,
  which = names(p),
  method = "Marq",
  transform = c("none", "log"),
  ...,
  ncores = detectCores(logical = FALSE)
)
Arguments
- ...
generic parameters, including parameters passed to the optimizer.
- formula
model formula specifying dependent, independent and grouping variables in the form:
dependent ~ independent | group1 + group2 + ....- data
data frame of observational data.
- p
named vector of start parameters and initial values of the growth model.
- lower
lower bound of the parameter vector.
- upper
upper bound of the parameter vector.
- which
vector of parameter names that are to be fitted.
- FUN
function of growth model to be fitted.
- method
character vector specifying the optimization algorithm.
- transform
fit model to non-transformed or log-transformed data.
- subset
a specification of the rows to be used: defaults to all rows.
- ncores
number of CPU cores used for parallel computation. The number of real cores is detected automatically by default, but fort debugging purposes it could be wise to set
ncores = 1. Usage of logical (hyperthreading) cores does not speed up computation.- grouping
vector of grouping variables defining subsets in the data frame.
- time
character vector with name of independent variable.
- y
character vector with name of dependent variable.
See also
Other fitting functions:
all_easylinear(),
all_splines(),
fit_easylinear(),
fit_growthmodel(),
fit_spline()
Examples
data(bactgrowth)
splitted.data <- multisplit(value ~ time | strain + conc + replicate,
data = bactgrowth)
## show which experiments are in splitted.data
names(splitted.data)
#> [1] "D:0:1" "R:0:1" "T:0:1" "D:0.24:1" "R:0.24:1" "T:0.24:1"
#> [7] "D:0.49:1" "R:0.49:1" "T:0.49:1" "D:0.98:1" "R:0.98:1" "T:0.98:1"
#> [13] "D:1.95:1" "R:1.95:1" "T:1.95:1" "D:3.91:1" "R:3.91:1" "T:3.91:1"
#> [19] "D:7.81:1" "R:7.81:1" "T:7.81:1" "D:15.63:1" "R:15.63:1" "T:15.63:1"
#> [25] "D:31.25:1" "R:31.25:1" "T:31.25:1" "D:62.5:1" "R:62.5:1" "T:62.5:1"
#> [31] "D:125:1" "R:125:1" "T:125:1" "D:250:1" "R:250:1" "T:250:1"
#> [37] "D:0:2" "R:0:2" "T:0:2" "D:0.24:2" "R:0.24:2" "T:0.24:2"
#> [43] "D:0.49:2" "R:0.49:2" "T:0.49:2" "D:0.98:2" "R:0.98:2" "T:0.98:2"
#> [49] "D:1.95:2" "R:1.95:2" "T:1.95:2" "D:3.91:2" "R:3.91:2" "T:3.91:2"
#> [55] "D:7.81:2" "R:7.81:2" "T:7.81:2" "D:15.63:2" "R:15.63:2" "T:15.63:2"
#> [61] "D:31.25:2" "R:31.25:2" "T:31.25:2" "D:62.5:2" "R:62.5:2" "T:62.5:2"
#> [67] "D:125:2" "R:125:2" "T:125:2" "D:250:2" "R:250:2" "T:250:2"
## get table from single experiment
dat <- splitted.data[["D:0:1"]]
fit0 <- fit_spline(dat$time, dat$value)
fit1 <- all_splines(value ~ time | strain + conc + replicate,
data = bactgrowth, spar = 0.5)
# \donttest{
## these examples require some CPU power and may take a bit longer
## initial parameters
p <- c(coef(fit0), K = max(dat$value))
## avoid negative parameters
lower = c(y0 = 0, mumax = 0, K = 0)
## fit all models
fit2 <- all_growthmodels(value ~ time | strain + conc + replicate,
data = bactgrowth, FUN=grow_logistic,
p = p, lower = lower, ncores = 2)
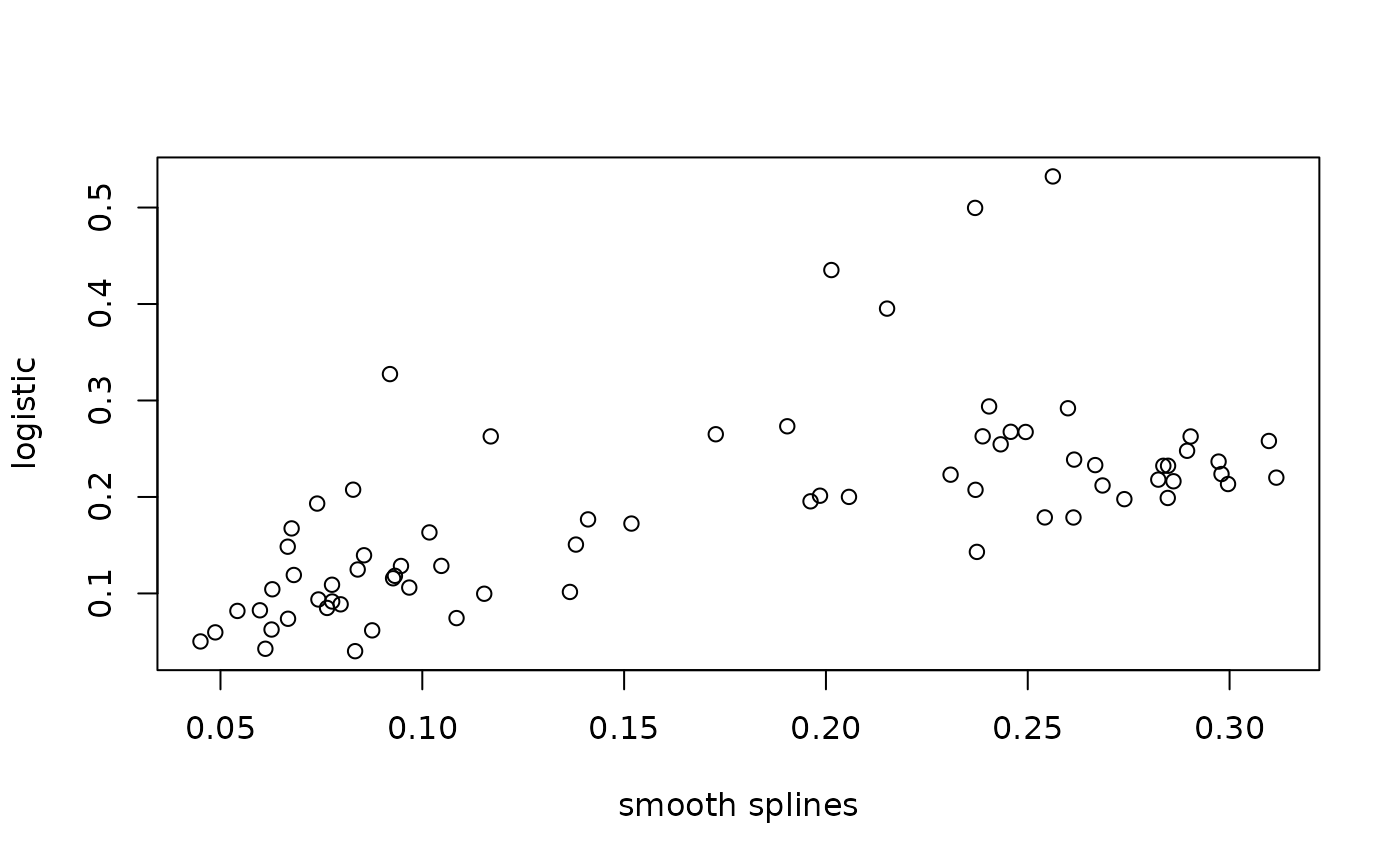
results1 <- results(fit1)
results2 <- results(fit2)
plot(results1$mumax, results2$mumax, xlab="smooth splines", ylab="logistic")
 ## experimental: nonlinear model as part of the formula
fit3 <- all_growthmodels(
value ~ grow_logistic(time, parms) | strain + conc + replicate,
data = bactgrowth, p = p, lower = lower, ncores = 2)
## this allows also to fit to the 'global' data set or any subsets
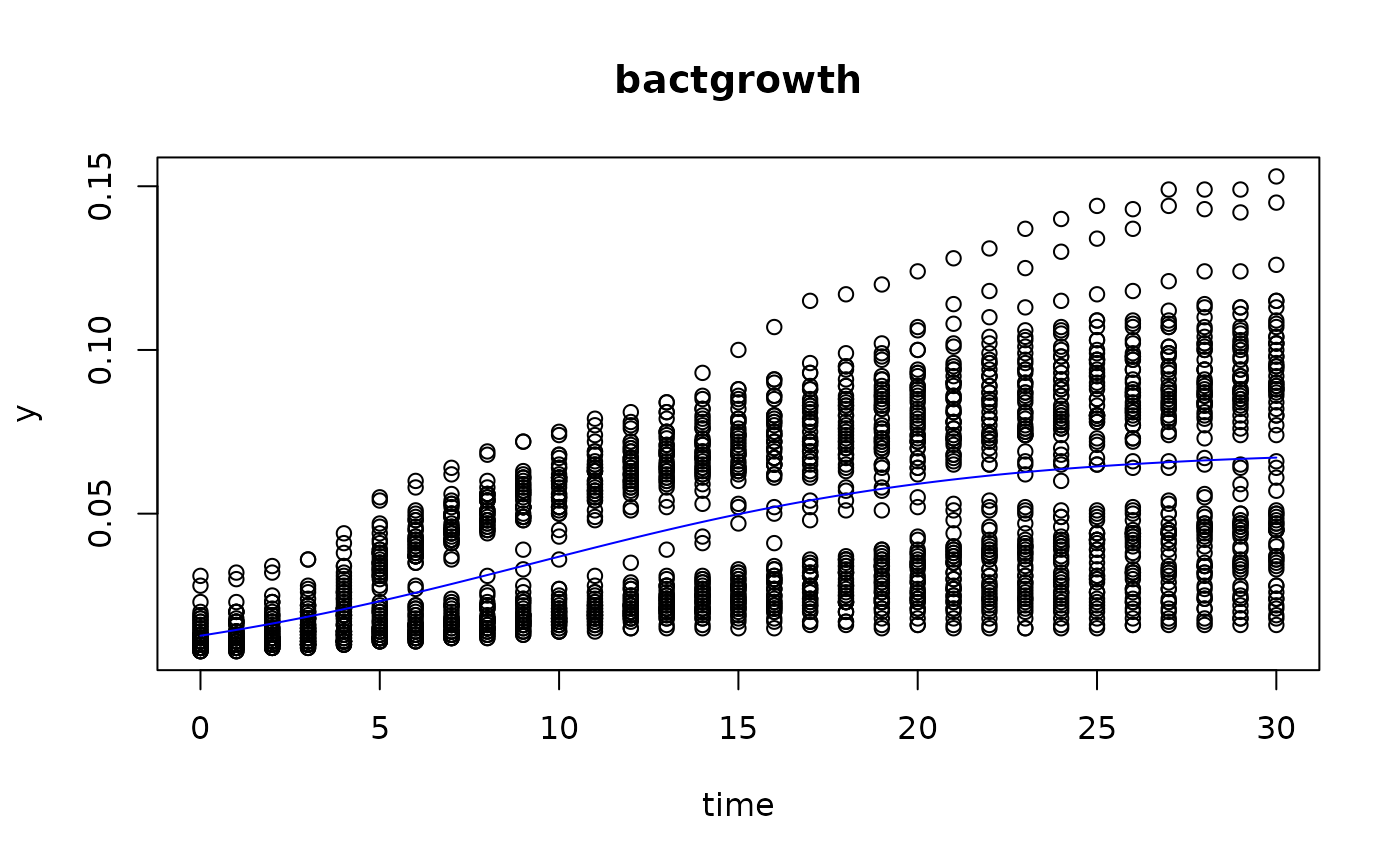
fit4 <- all_growthmodels(
value ~ grow_logistic(time, parms),
data = bactgrowth, p = p, lower = lower, ncores = 1)
#> Warning: collapsing to unique 'x' values
#> Warning: collapsing to unique 'x' values
#> Warning: collapsing to unique 'x' values
#> Warning: collapsing to unique 'x' values
#> Warning: collapsing to unique 'x' values
#> Warning: collapsing to unique 'x' values
#> Warning: collapsing to unique 'x' values
#> Warning: collapsing to unique 'x' values
#> Warning: collapsing to unique 'x' values
#> Warning: collapsing to unique 'x' values
#> Warning: collapsing to unique 'x' values
#> Warning: collapsing to unique 'x' values
#> Warning: collapsing to unique 'x' values
#> Warning: collapsing to unique 'x' values
#> Warning: collapsing to unique 'x' values
#> Warning: collapsing to unique 'x' values
#> Warning: collapsing to unique 'x' values
#> Warning: collapsing to unique 'x' values
#> Warning: collapsing to unique 'x' values
#> Warning: collapsing to unique 'x' values
#> Warning: collapsing to unique 'x' values
#> Warning: collapsing to unique 'x' values
#> Warning: collapsing to unique 'x' values
#> Warning: collapsing to unique 'x' values
#> Warning: collapsing to unique 'x' values
#> Warning: collapsing to unique 'x' values
#> Warning: collapsing to unique 'x' values
#> Warning: collapsing to unique 'x' values
#> Warning: collapsing to unique 'x' values
#> Warning: collapsing to unique 'x' values
#> Warning: collapsing to unique 'x' values
#> Warning: collapsing to unique 'x' values
#> Warning: collapsing to unique 'x' values
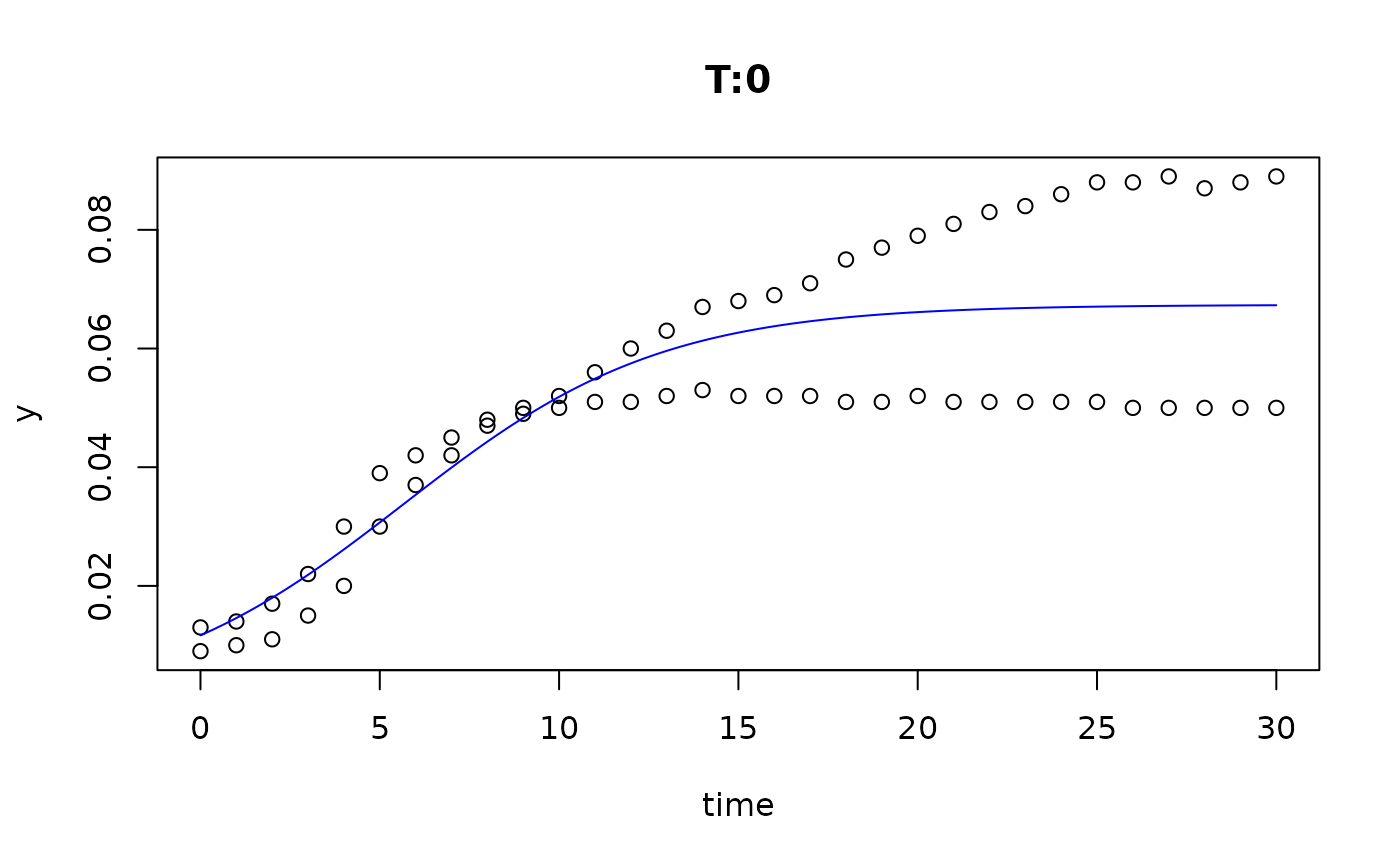
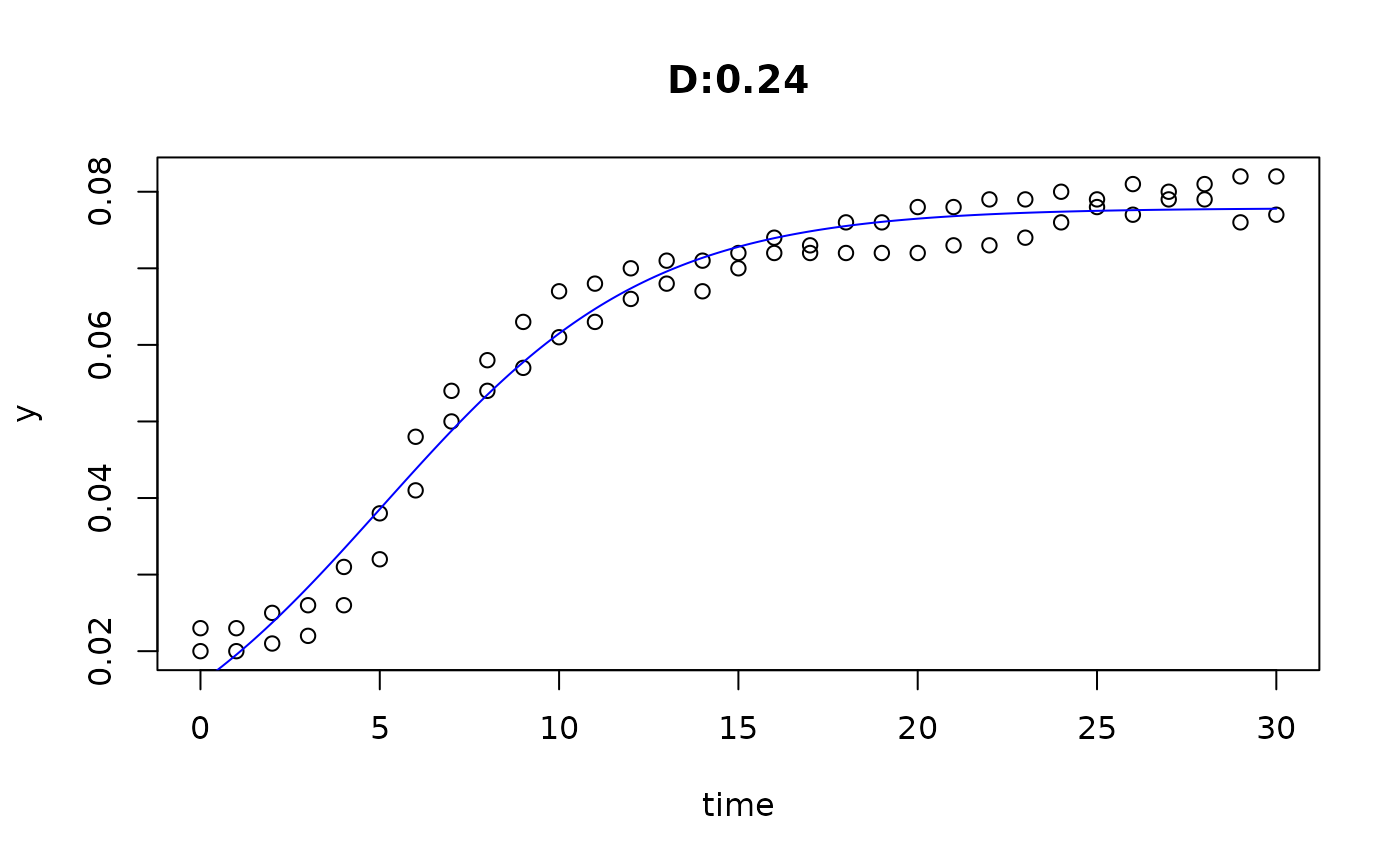
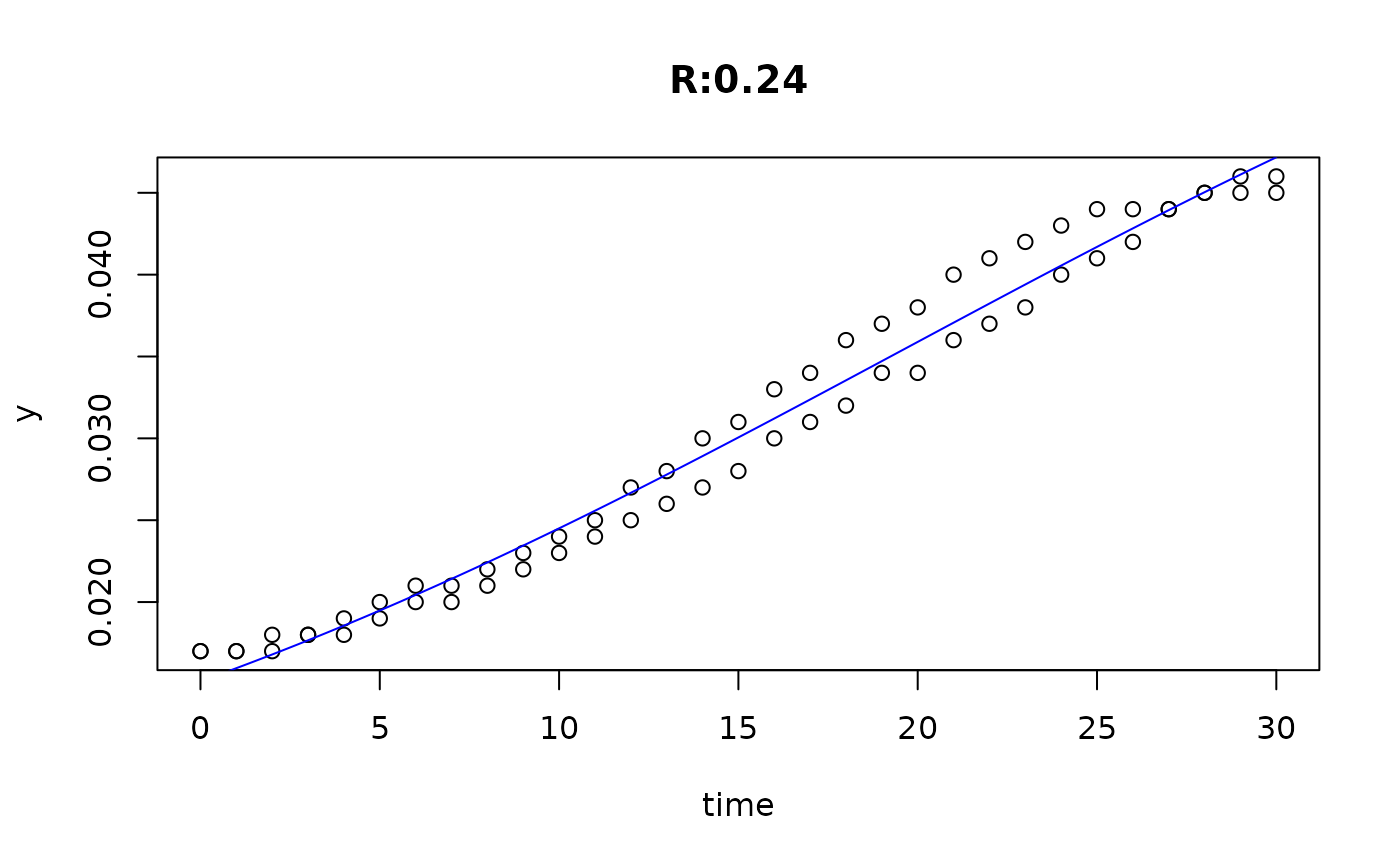
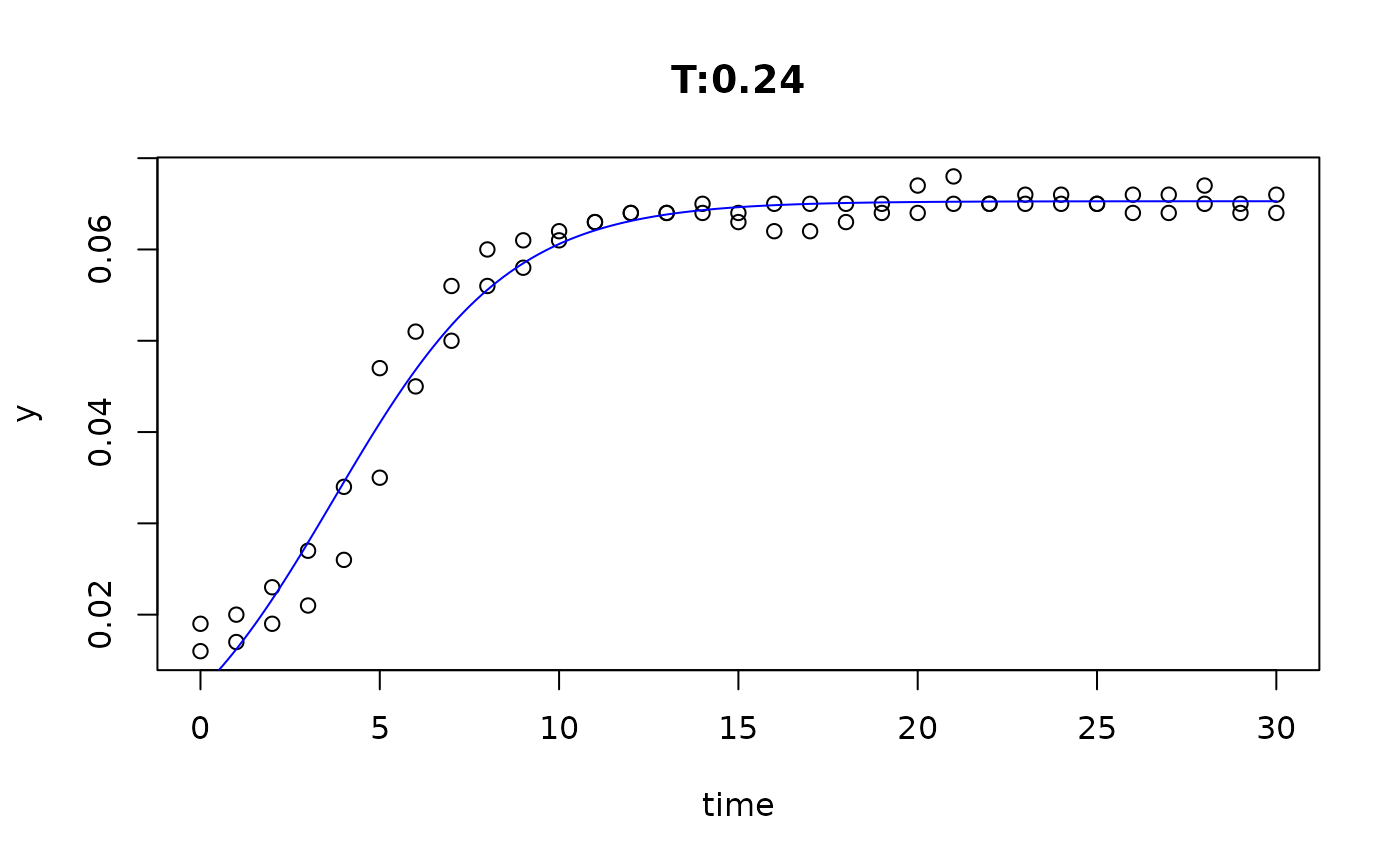
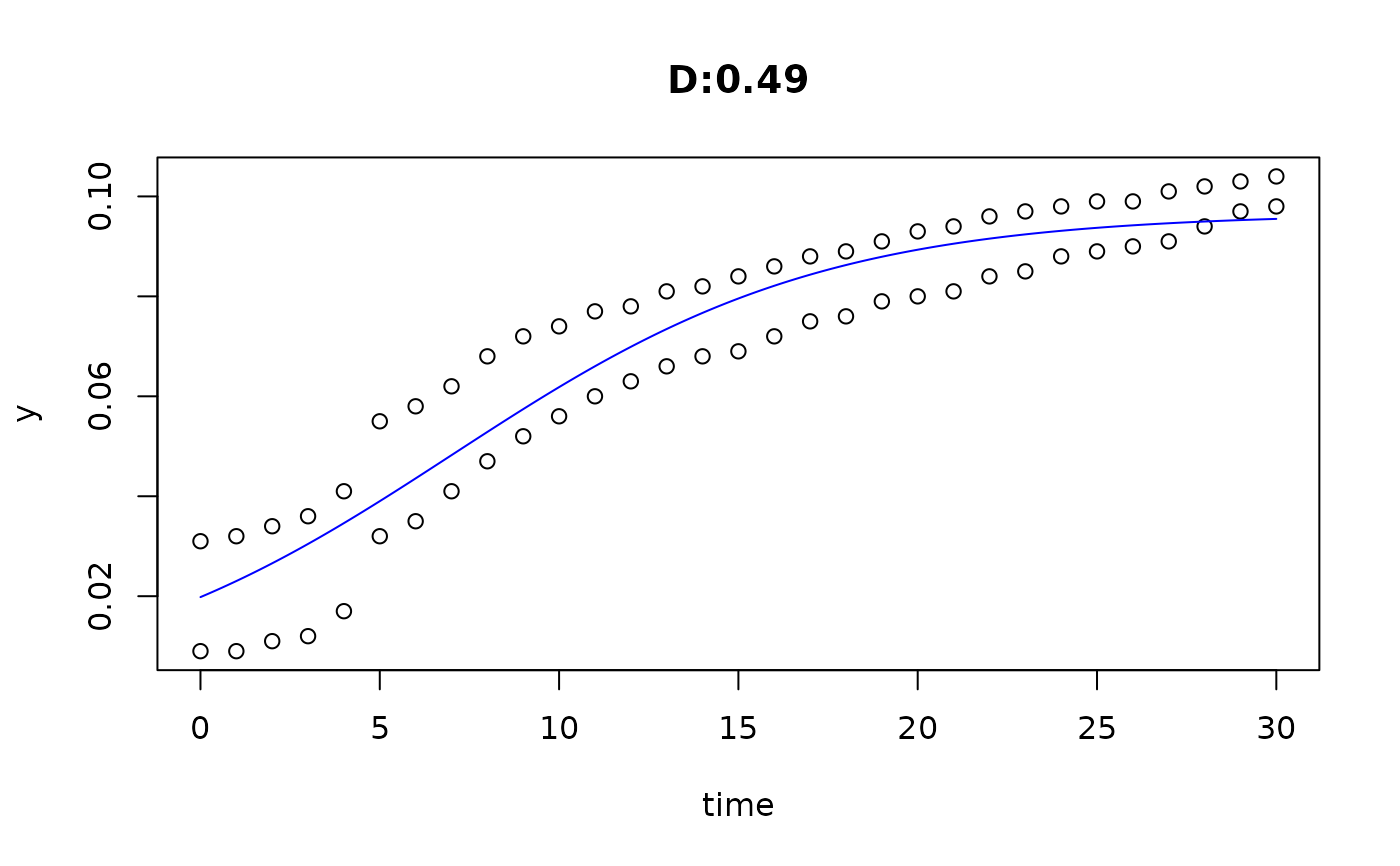
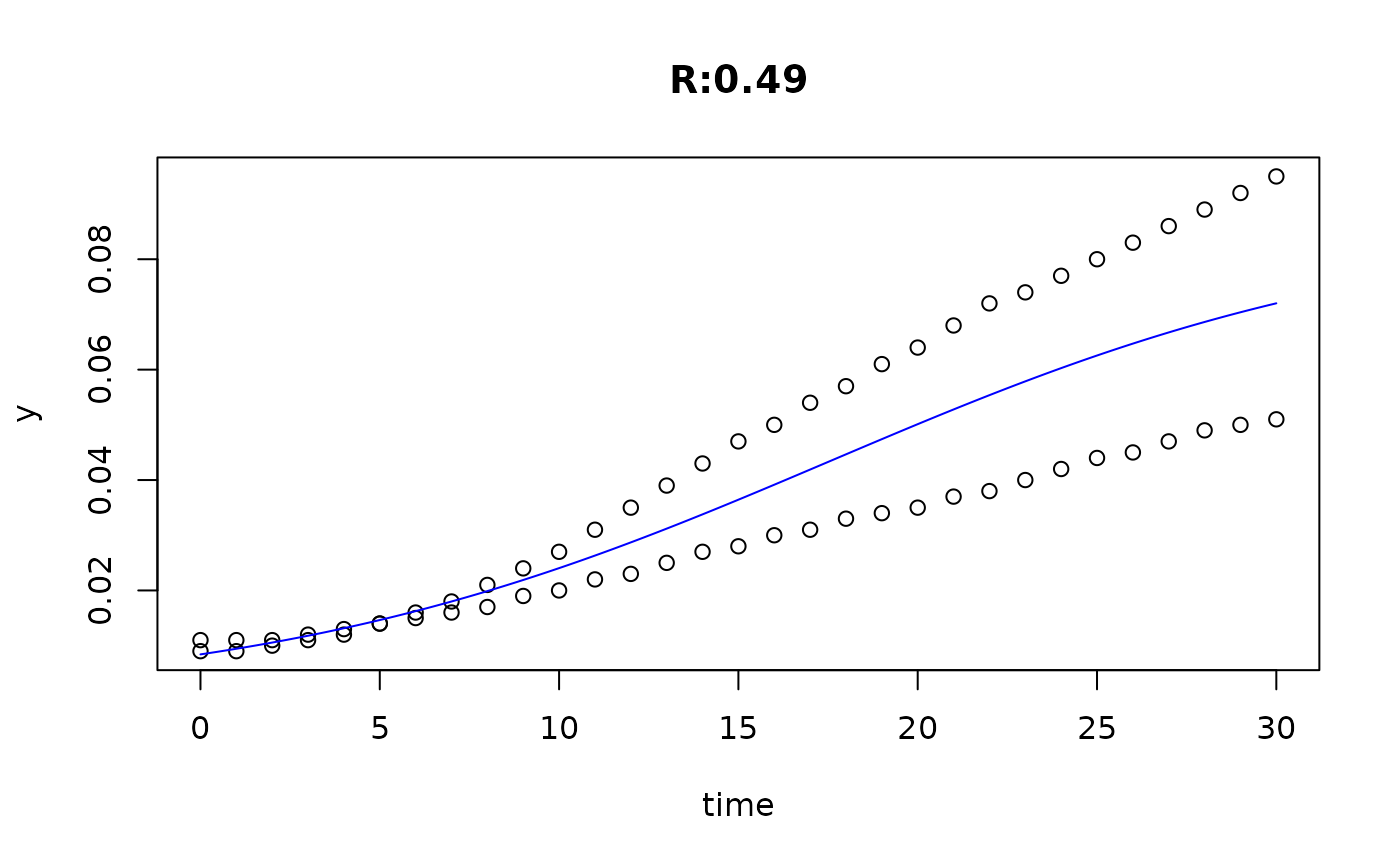
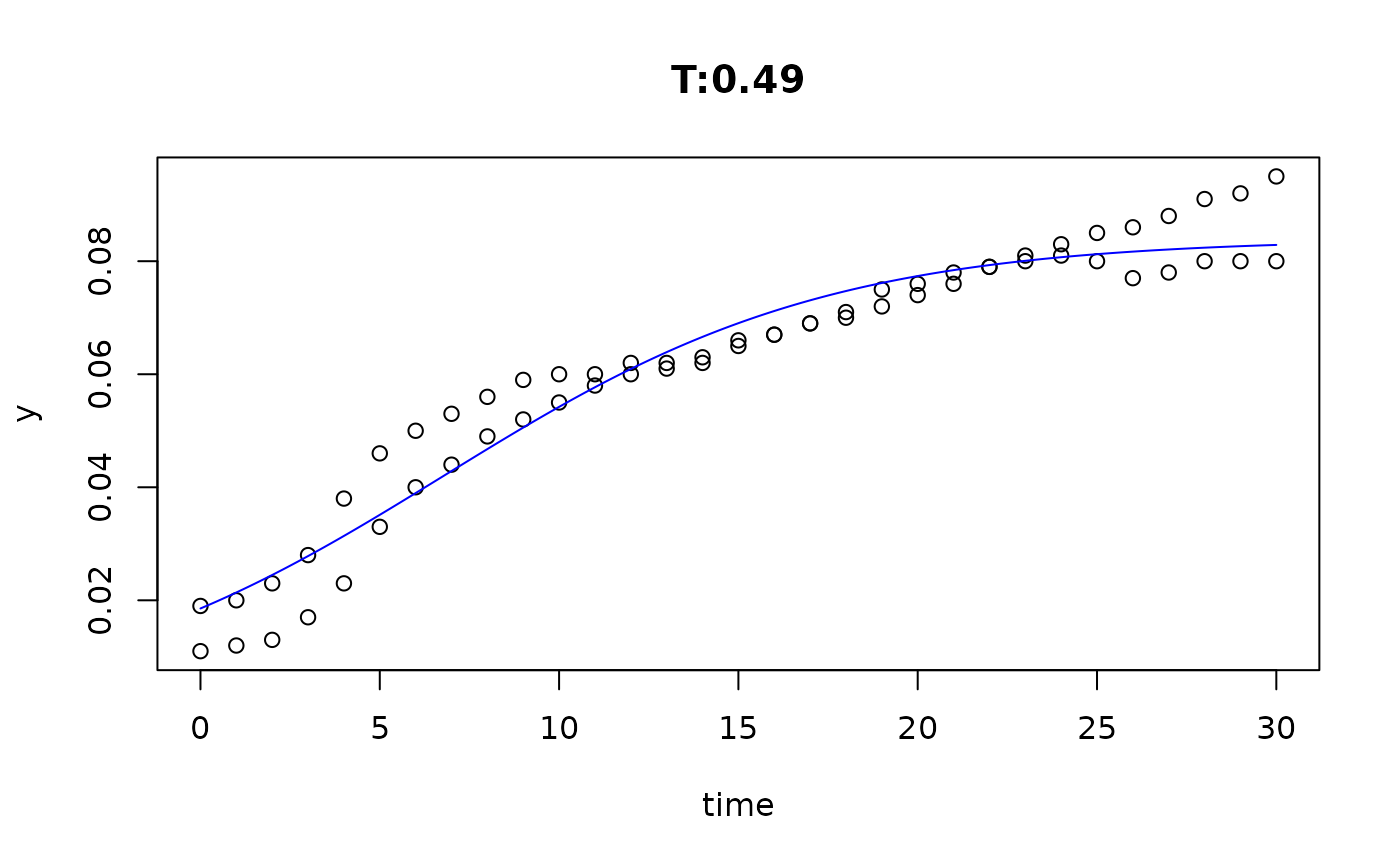
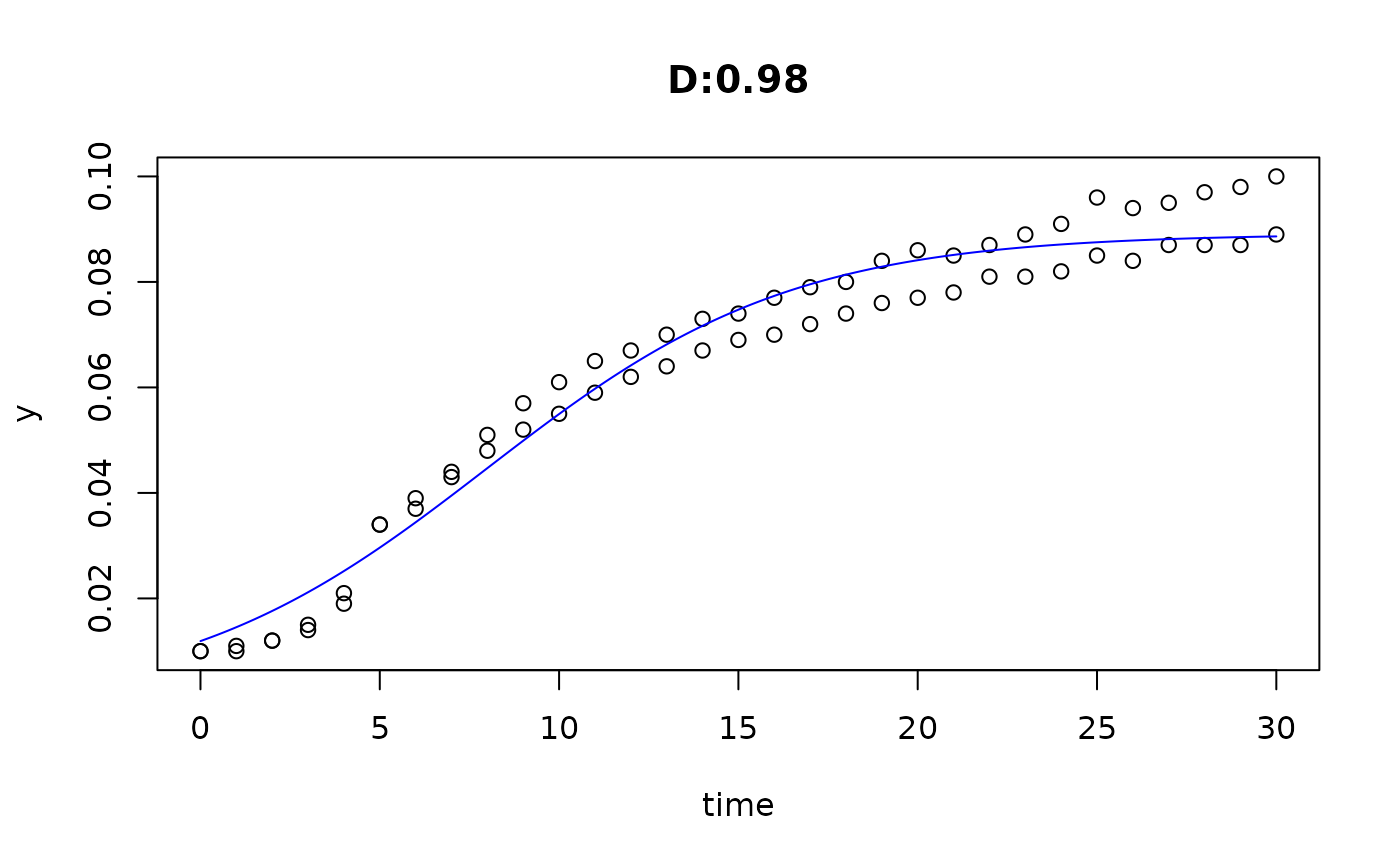
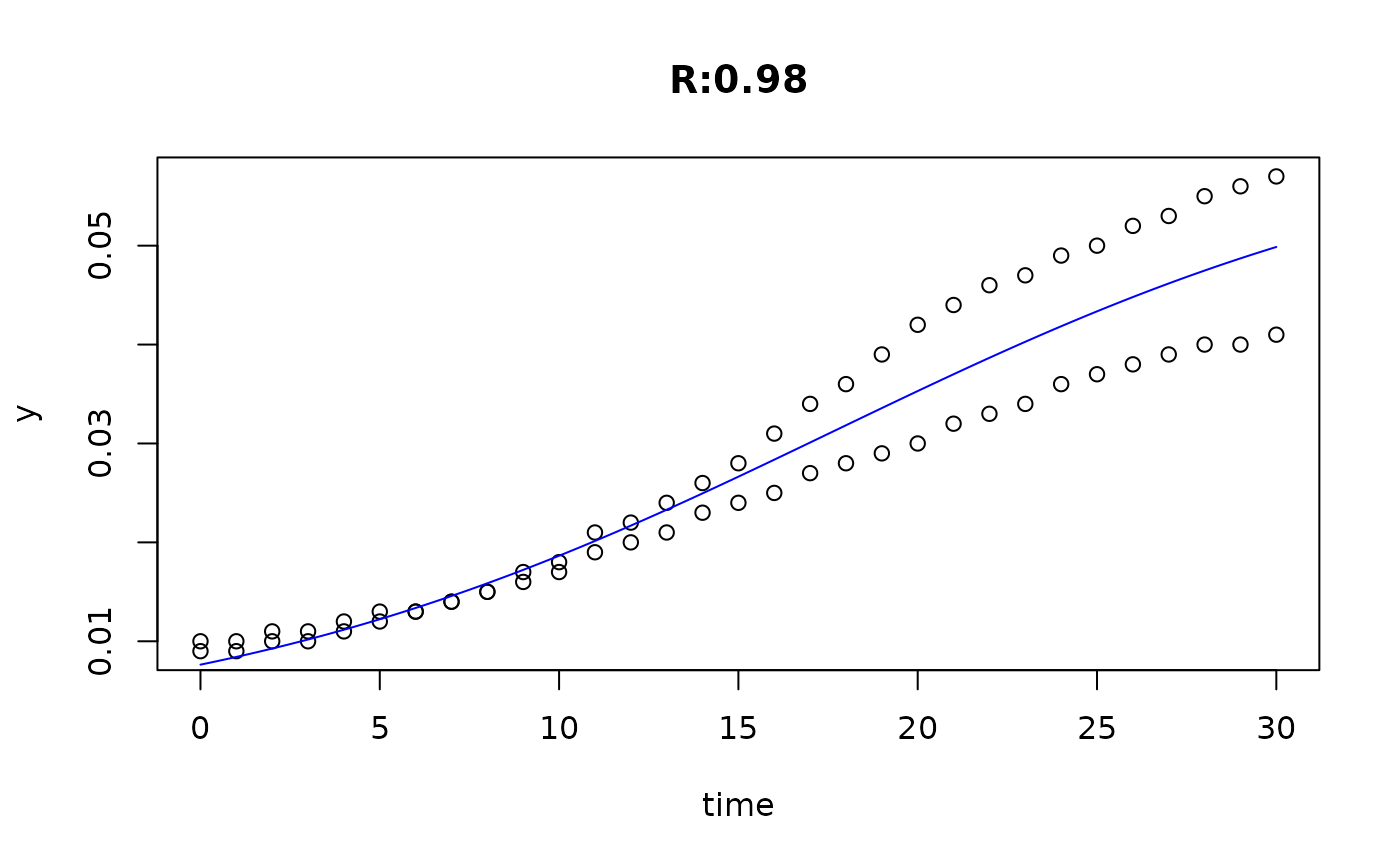
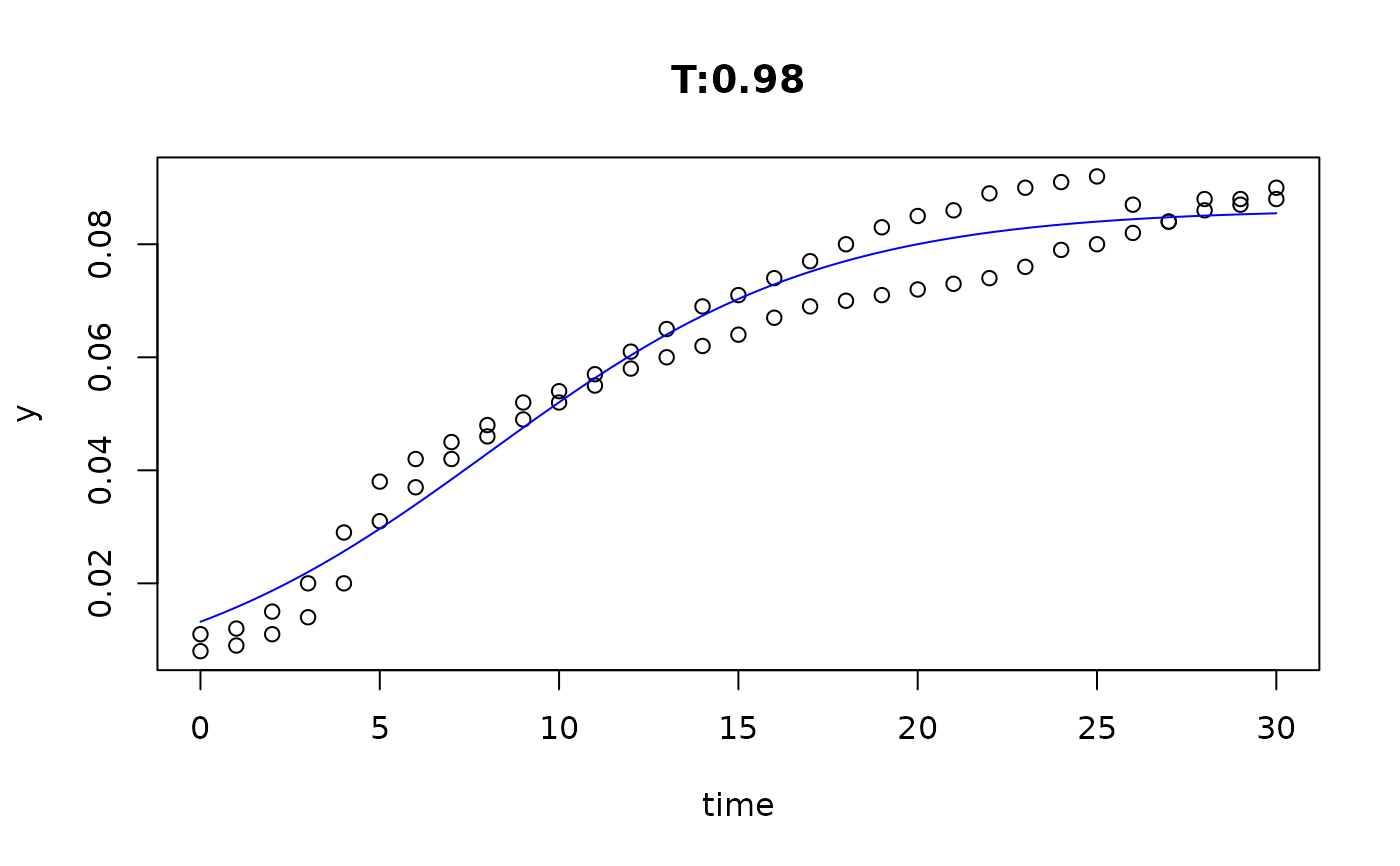
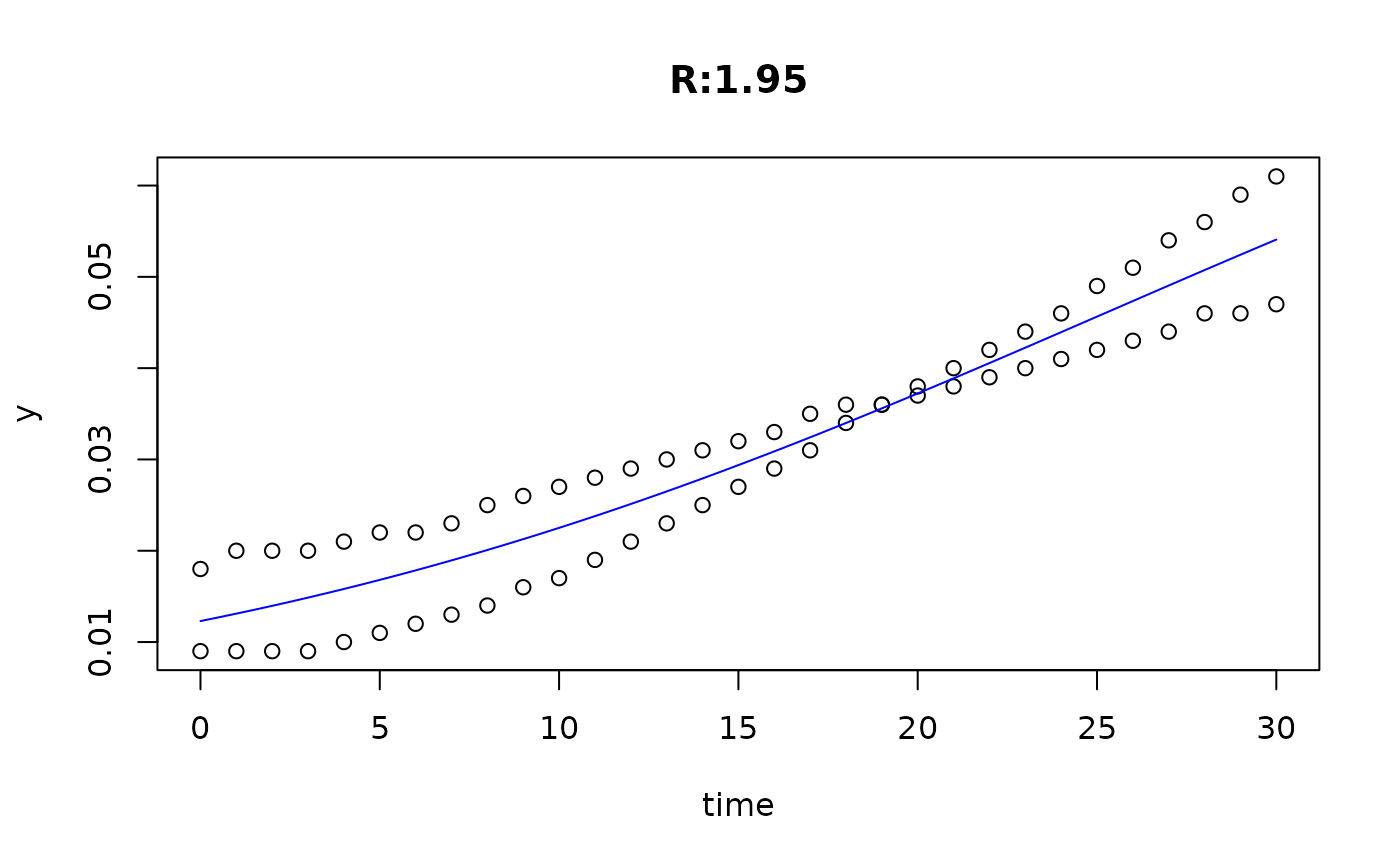
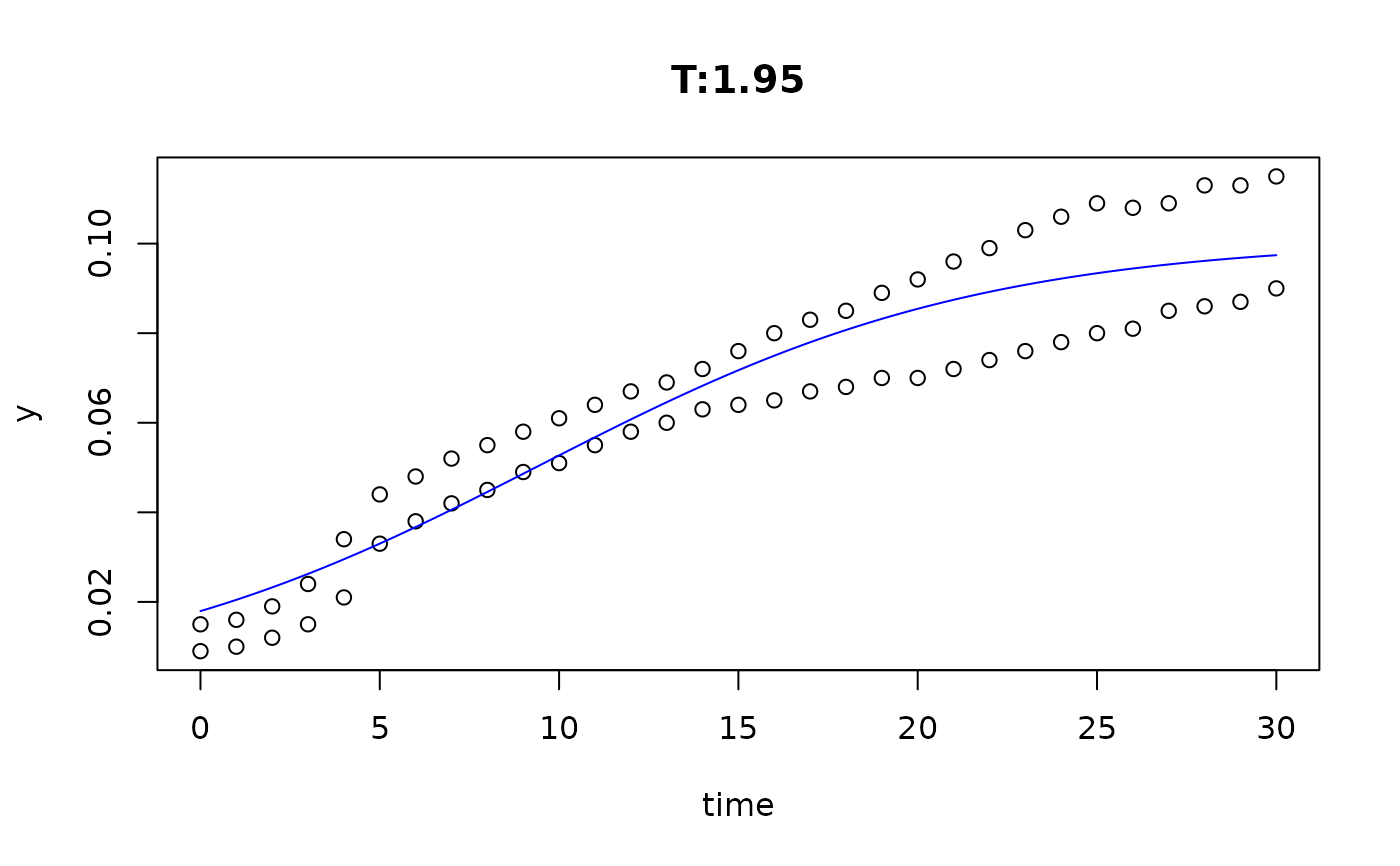
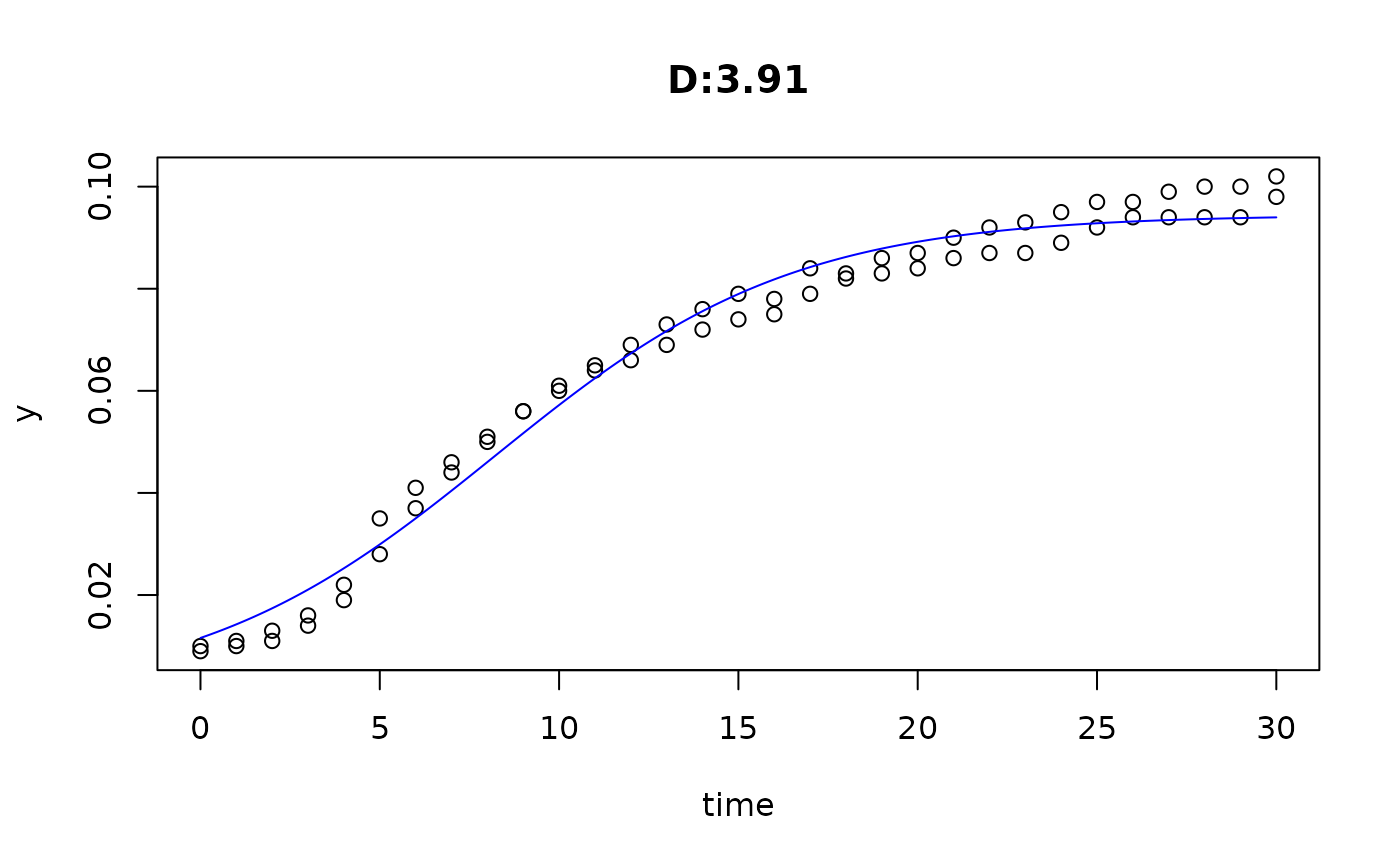
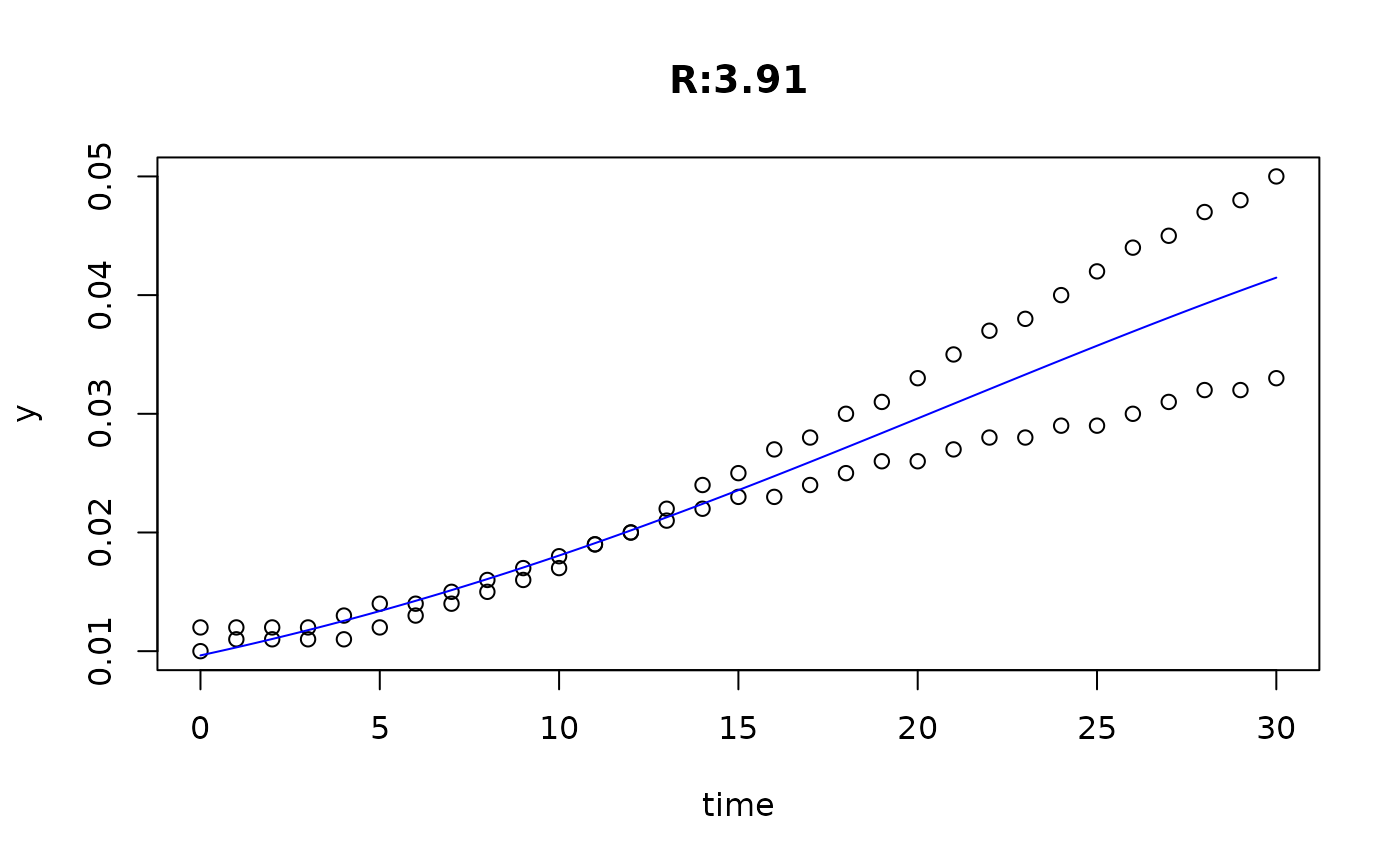
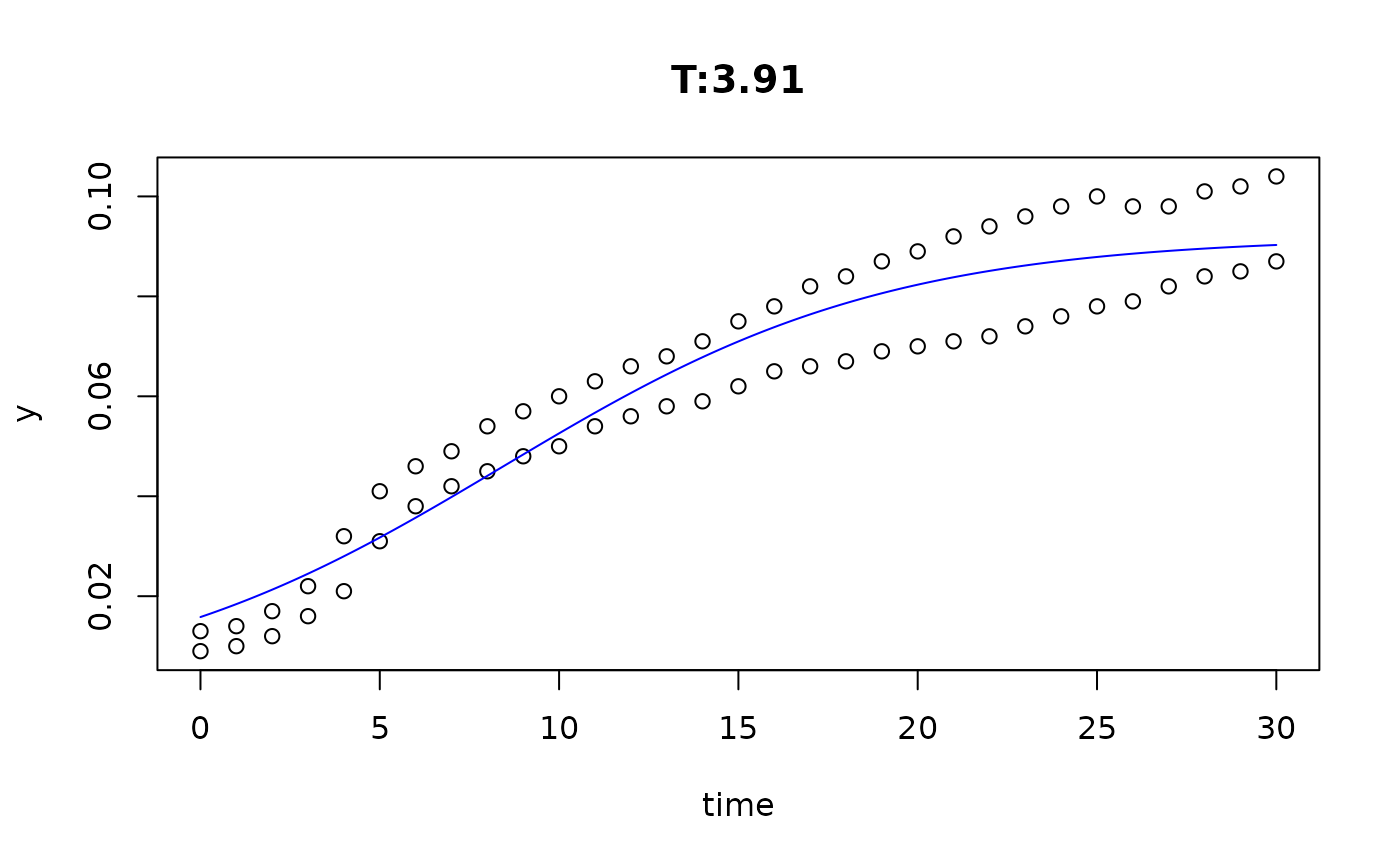
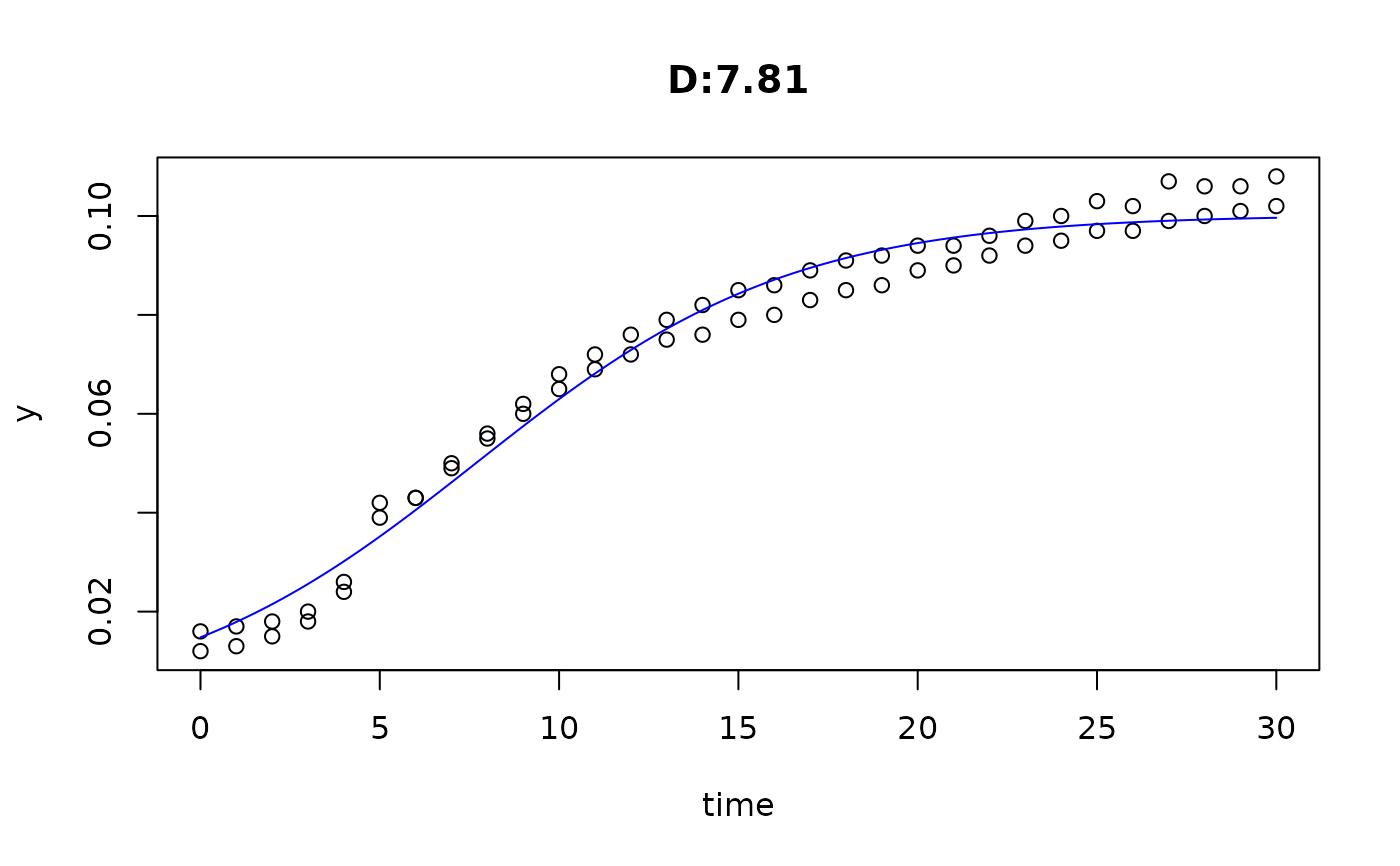
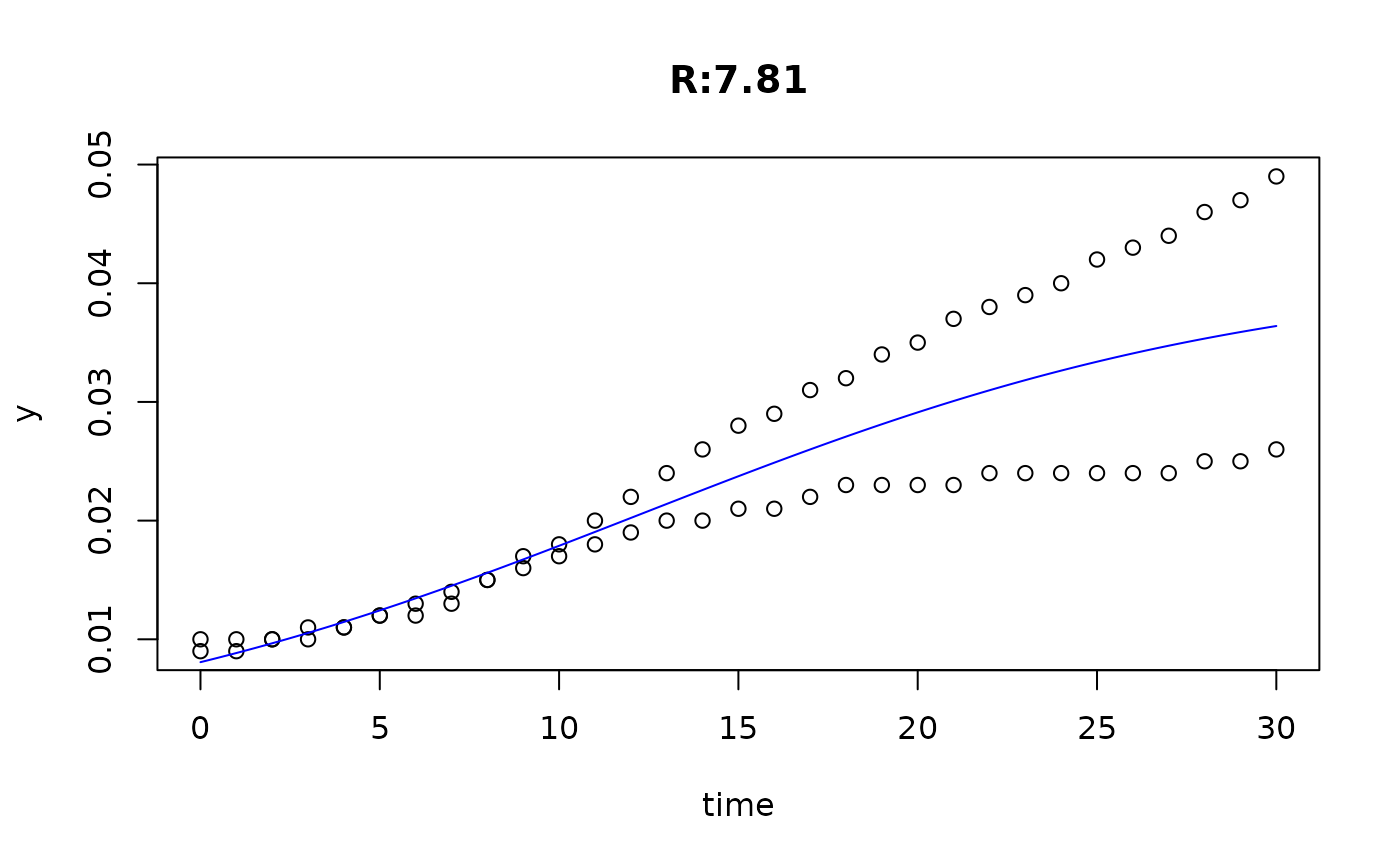
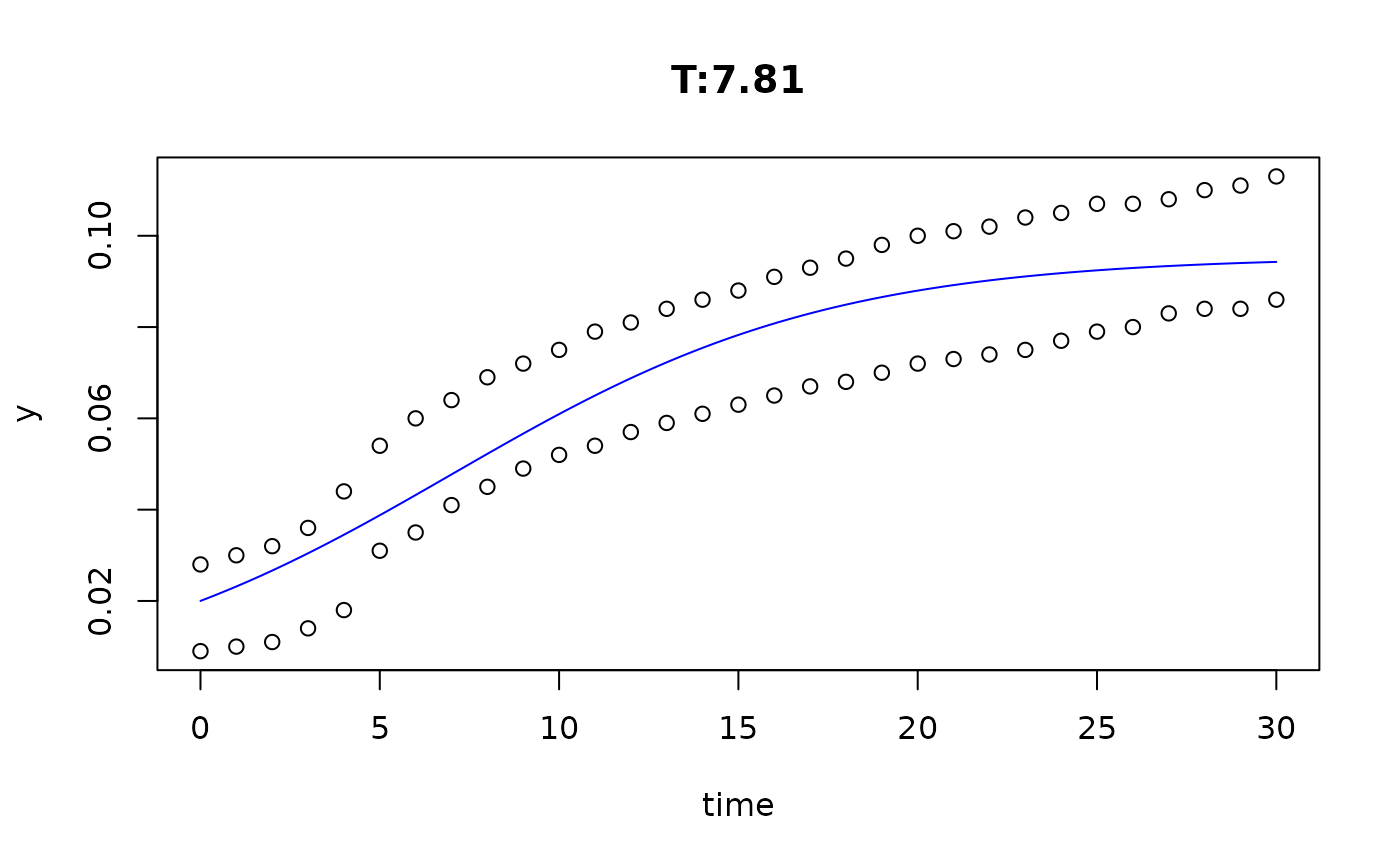
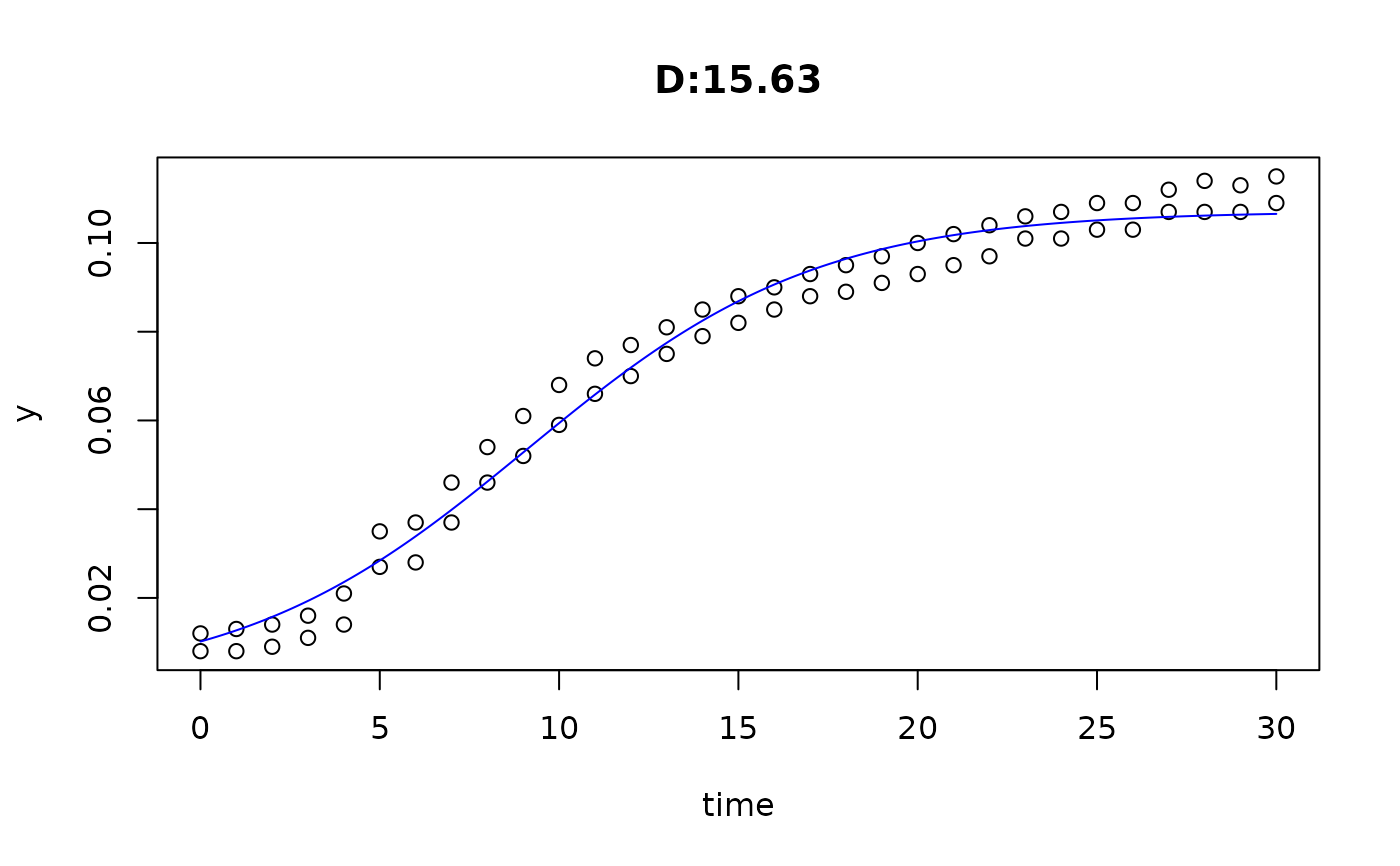
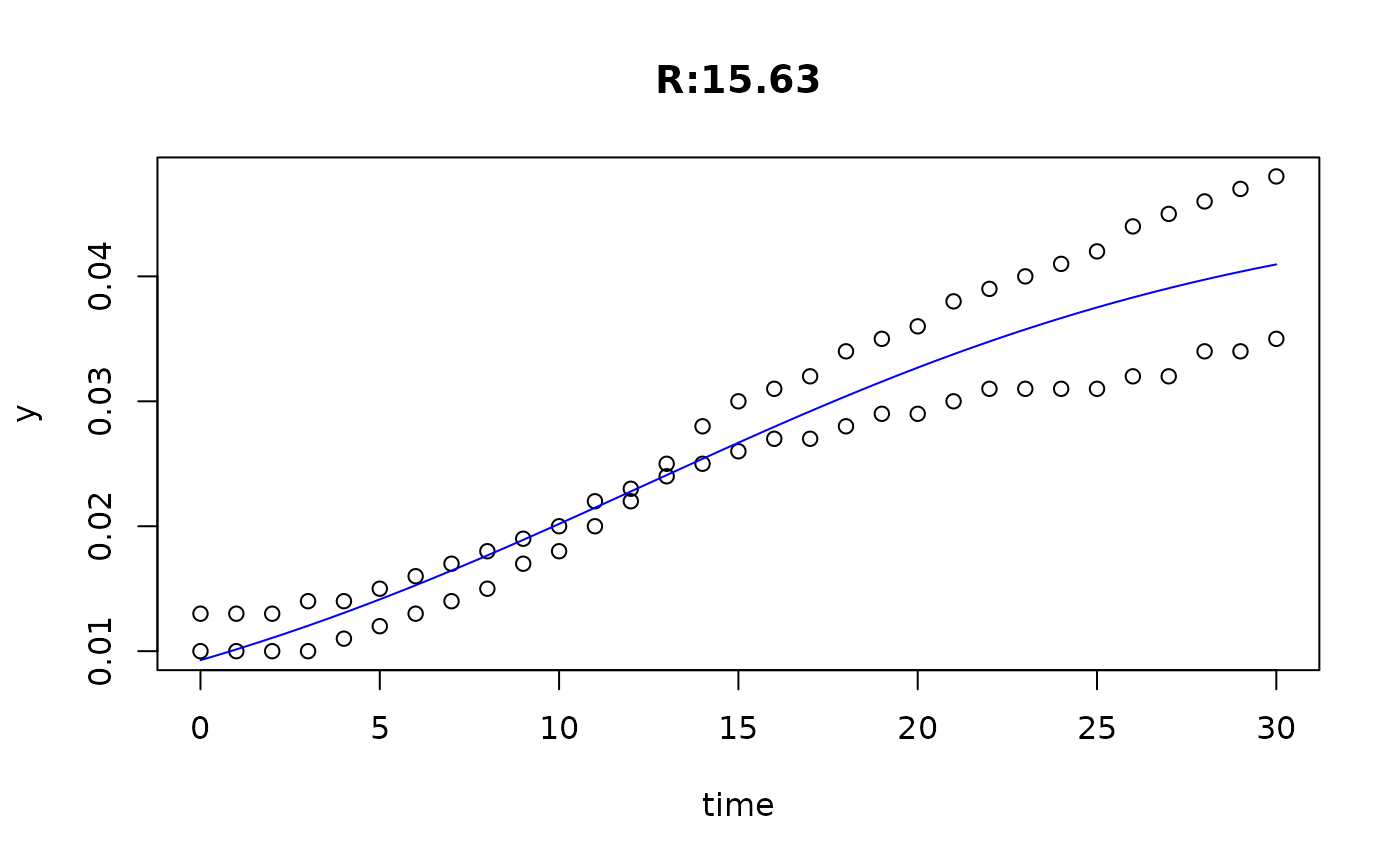
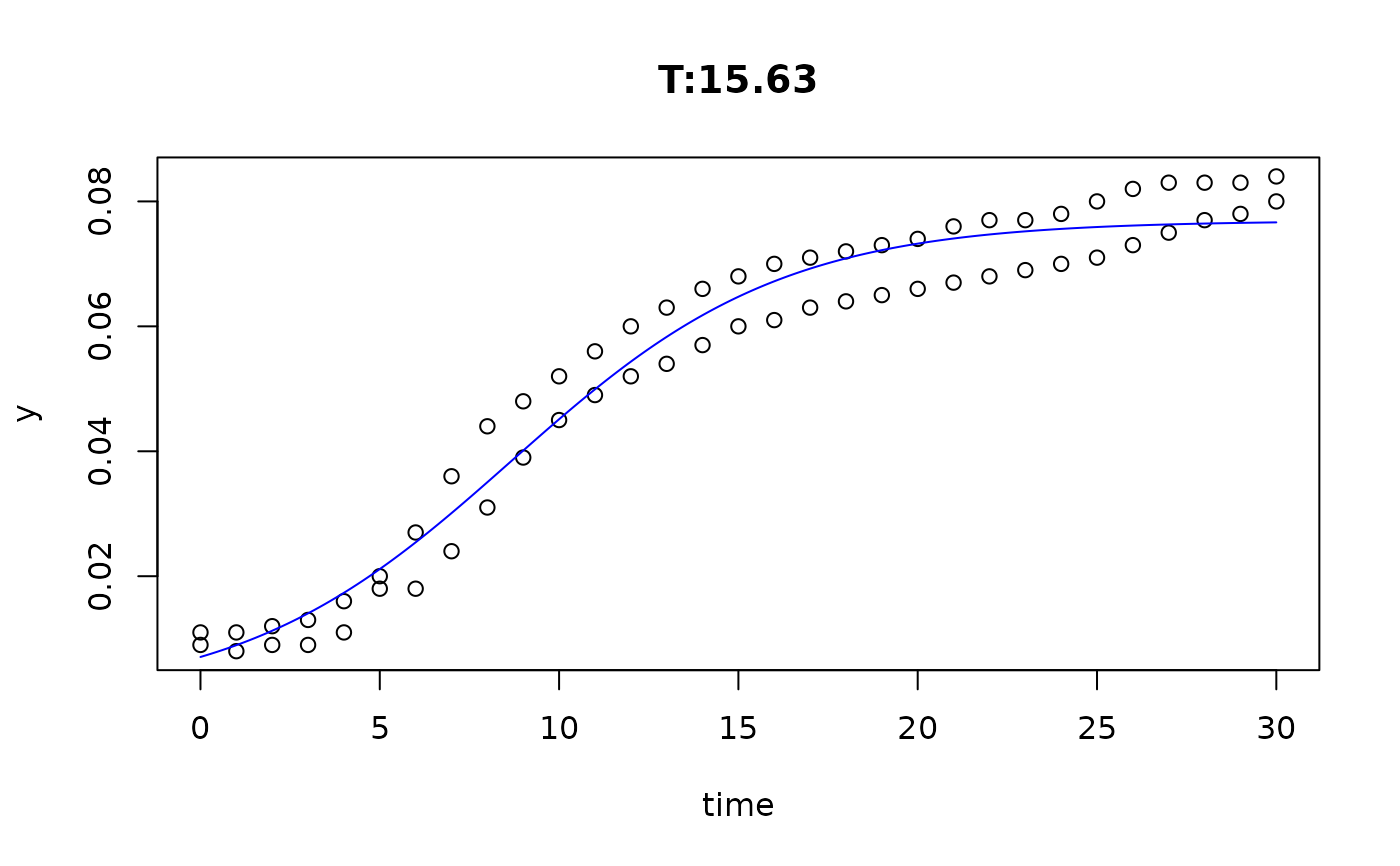
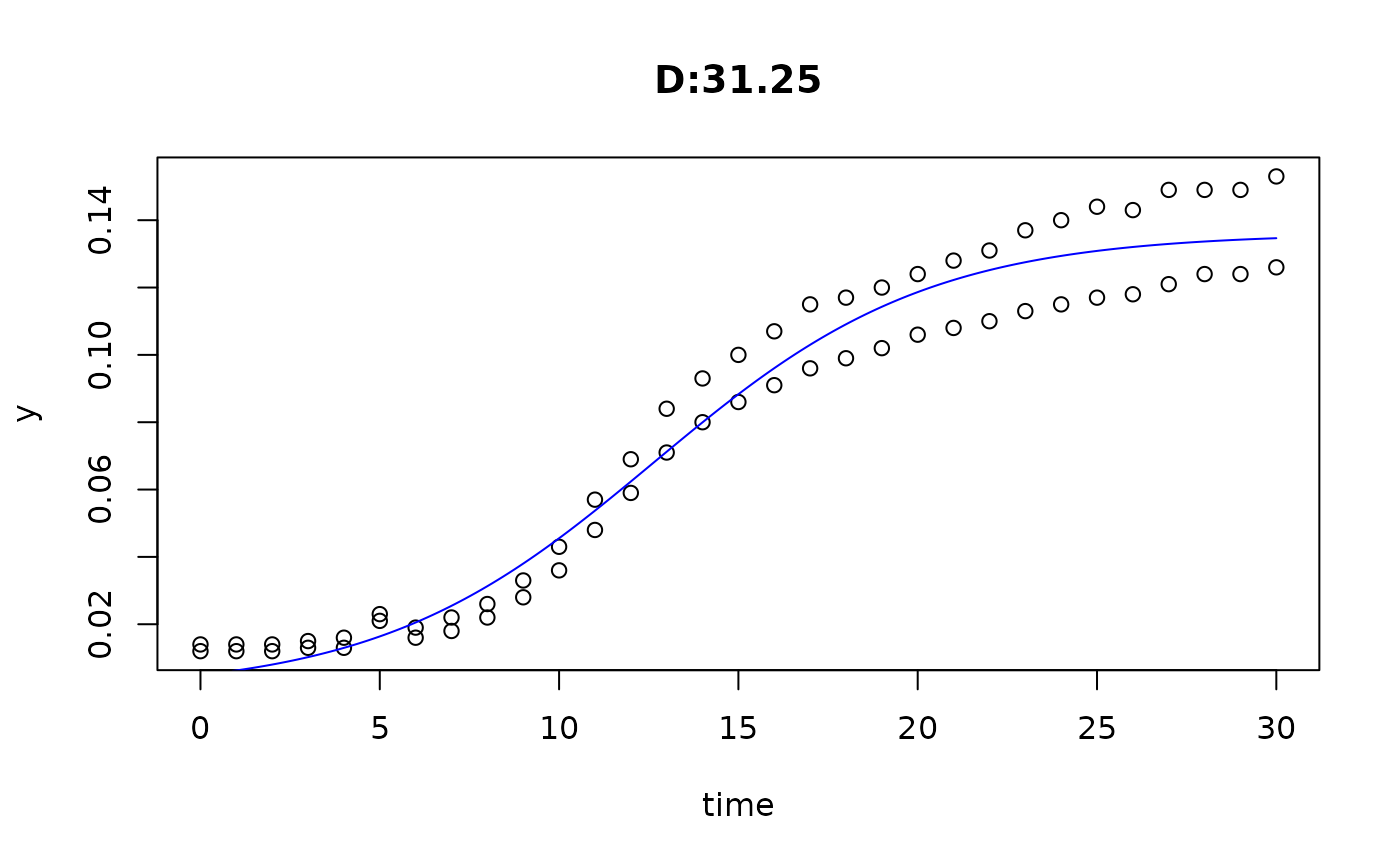
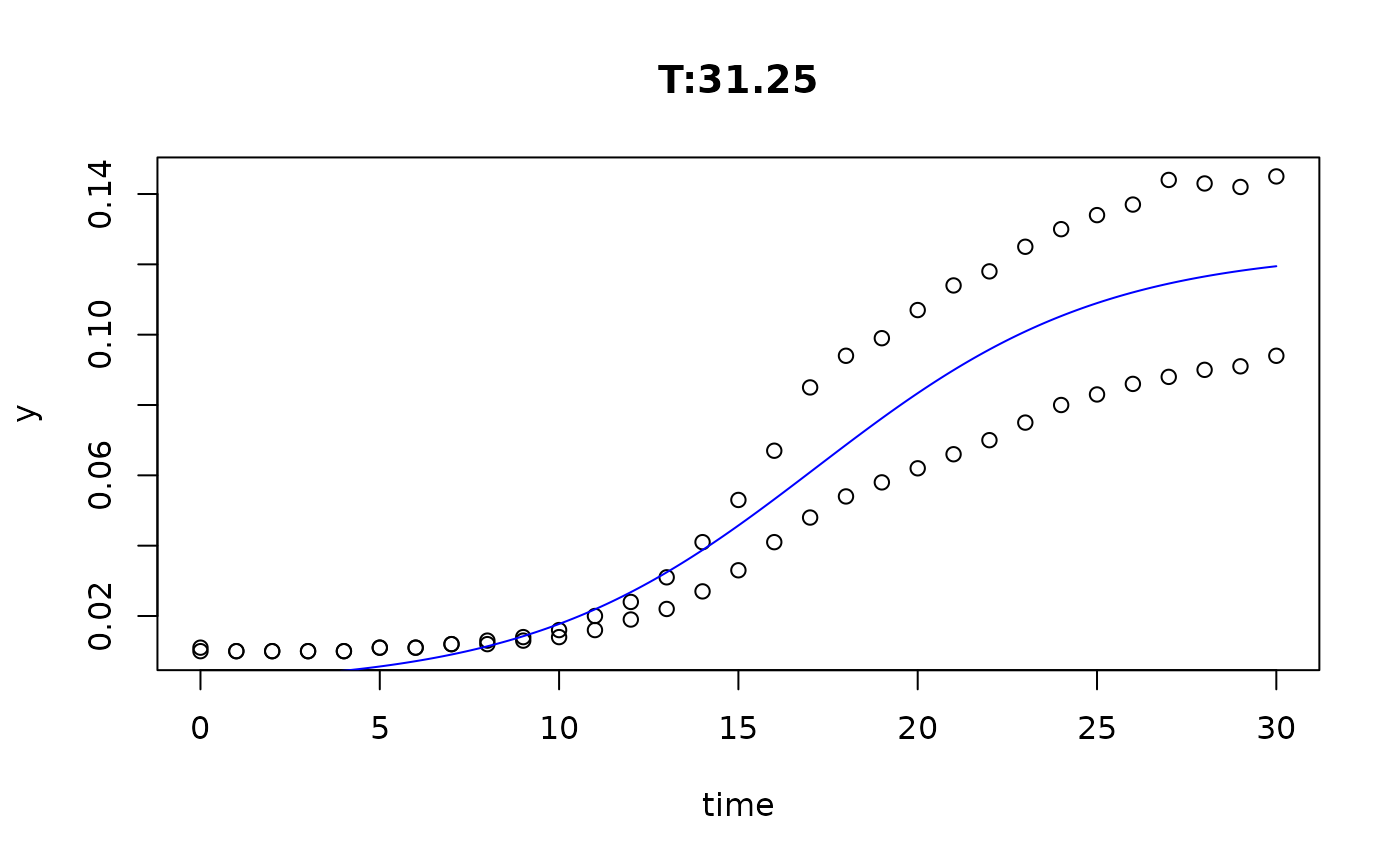
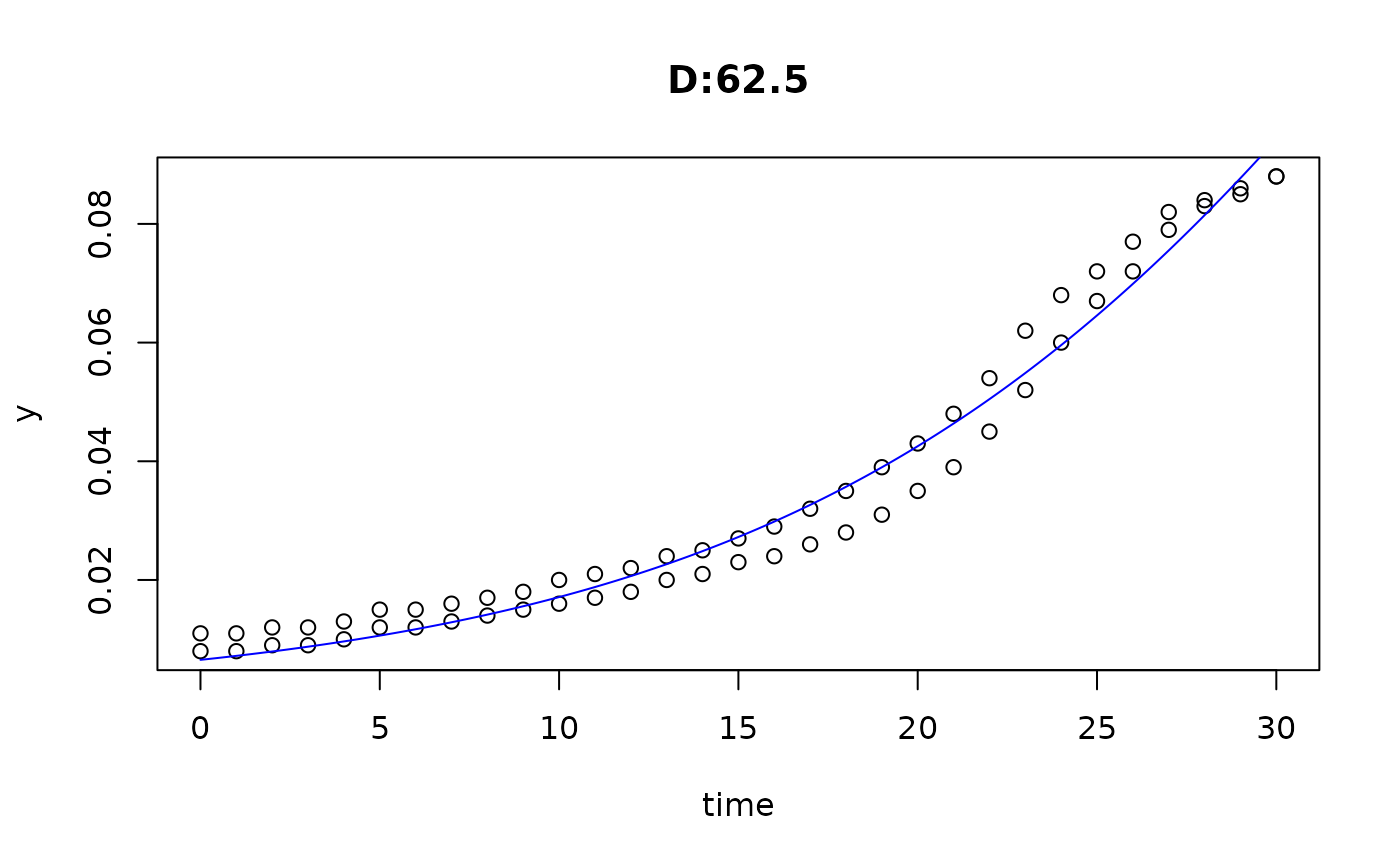
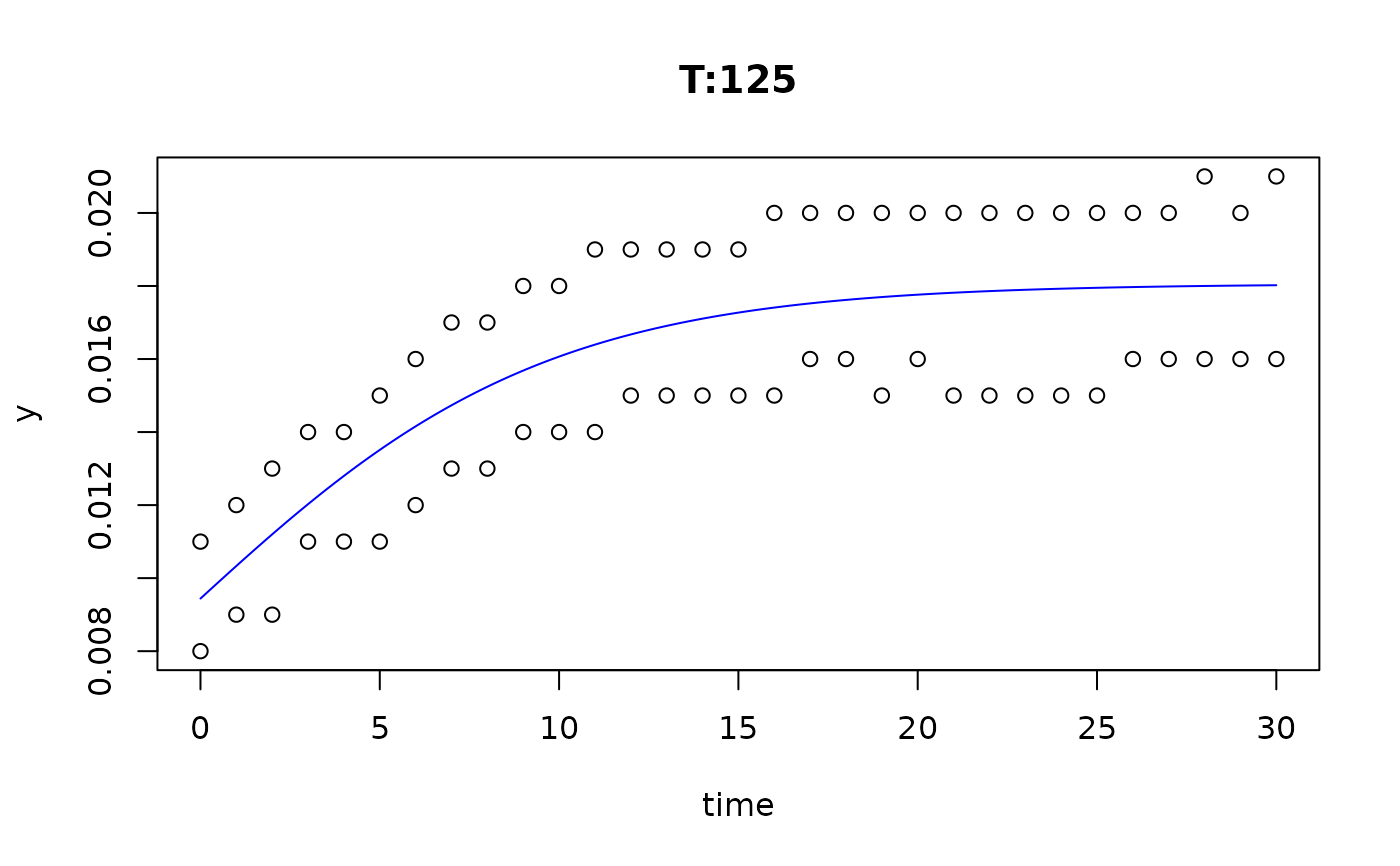
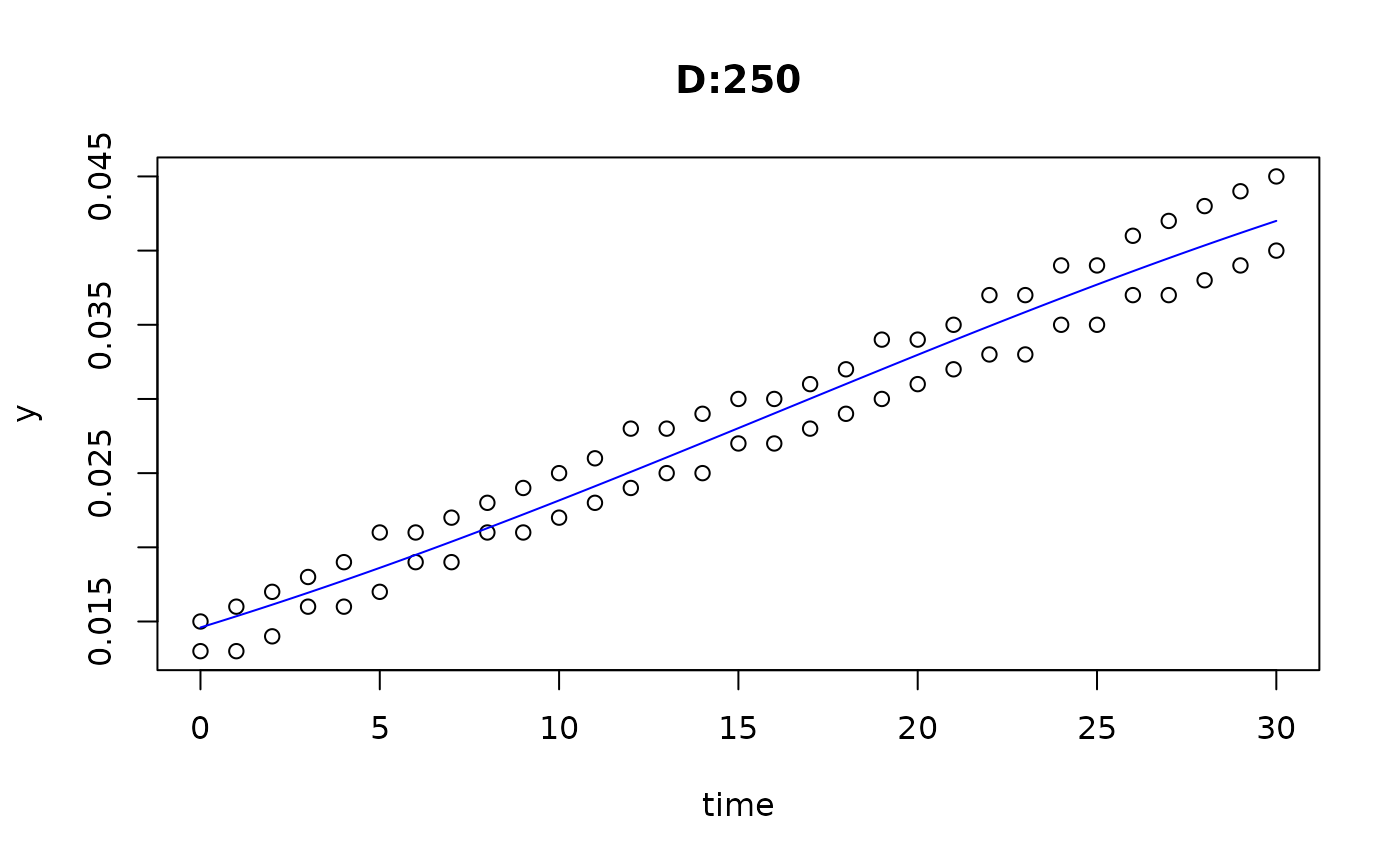
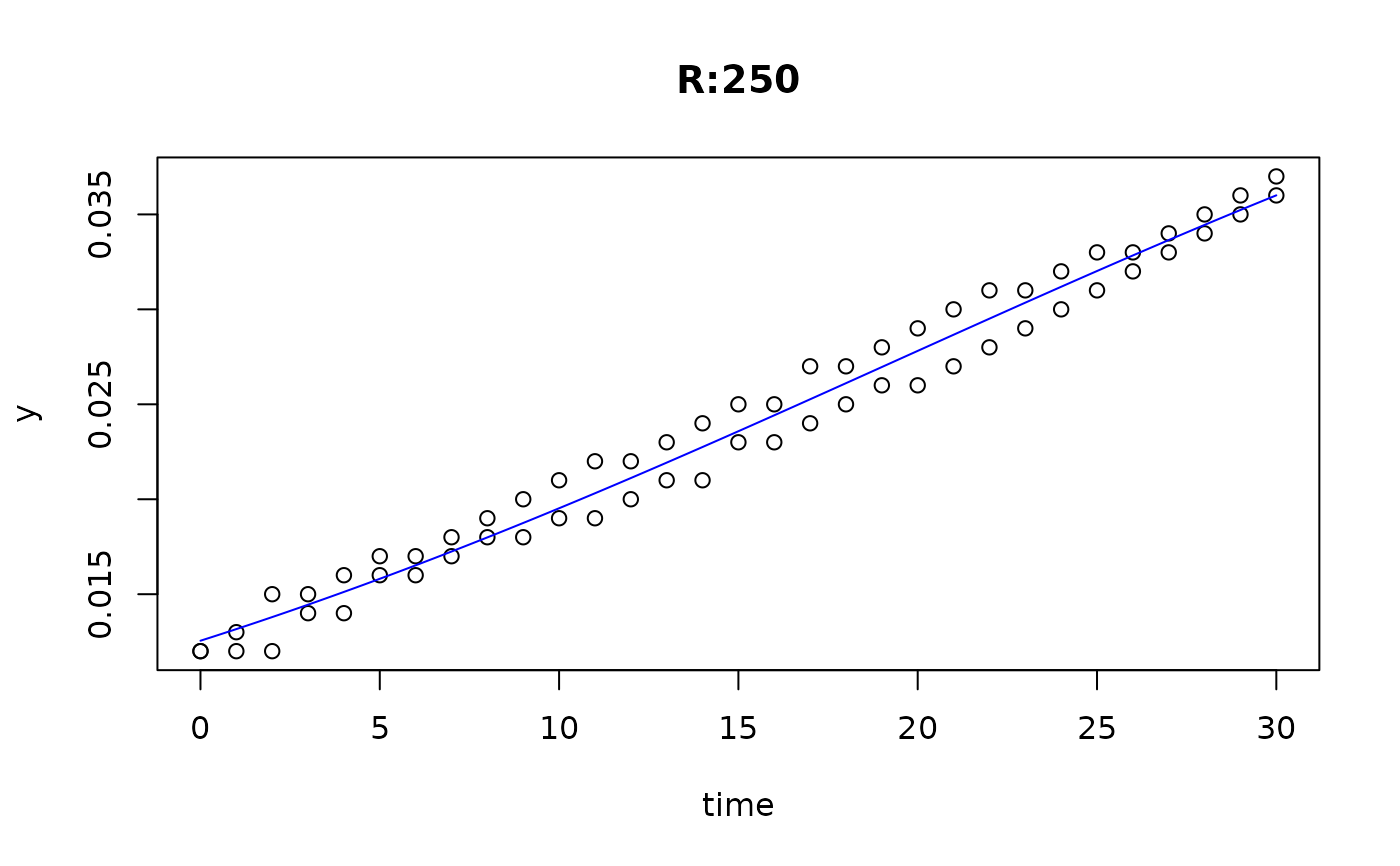
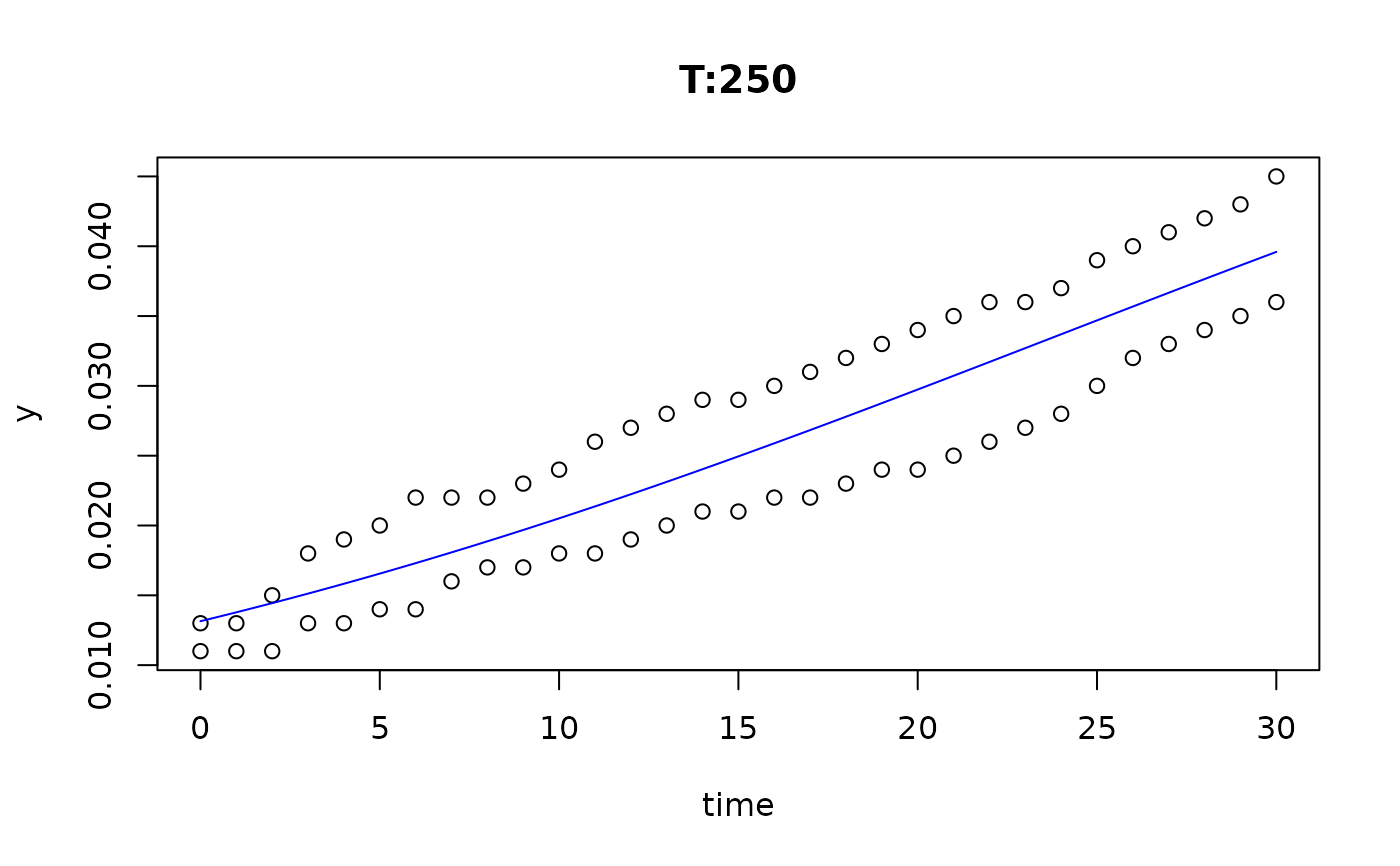
plot(fit4)
## experimental: nonlinear model as part of the formula
fit3 <- all_growthmodels(
value ~ grow_logistic(time, parms) | strain + conc + replicate,
data = bactgrowth, p = p, lower = lower, ncores = 2)
## this allows also to fit to the 'global' data set or any subsets
fit4 <- all_growthmodels(
value ~ grow_logistic(time, parms),
data = bactgrowth, p = p, lower = lower, ncores = 1)
#> Warning: collapsing to unique 'x' values
#> Warning: collapsing to unique 'x' values
#> Warning: collapsing to unique 'x' values
#> Warning: collapsing to unique 'x' values
#> Warning: collapsing to unique 'x' values
#> Warning: collapsing to unique 'x' values
#> Warning: collapsing to unique 'x' values
#> Warning: collapsing to unique 'x' values
#> Warning: collapsing to unique 'x' values
#> Warning: collapsing to unique 'x' values
#> Warning: collapsing to unique 'x' values
#> Warning: collapsing to unique 'x' values
#> Warning: collapsing to unique 'x' values
#> Warning: collapsing to unique 'x' values
#> Warning: collapsing to unique 'x' values
#> Warning: collapsing to unique 'x' values
#> Warning: collapsing to unique 'x' values
#> Warning: collapsing to unique 'x' values
#> Warning: collapsing to unique 'x' values
#> Warning: collapsing to unique 'x' values
#> Warning: collapsing to unique 'x' values
#> Warning: collapsing to unique 'x' values
#> Warning: collapsing to unique 'x' values
#> Warning: collapsing to unique 'x' values
#> Warning: collapsing to unique 'x' values
#> Warning: collapsing to unique 'x' values
#> Warning: collapsing to unique 'x' values
#> Warning: collapsing to unique 'x' values
#> Warning: collapsing to unique 'x' values
#> Warning: collapsing to unique 'x' values
#> Warning: collapsing to unique 'x' values
#> Warning: collapsing to unique 'x' values
#> Warning: collapsing to unique 'x' values
plot(fit4)
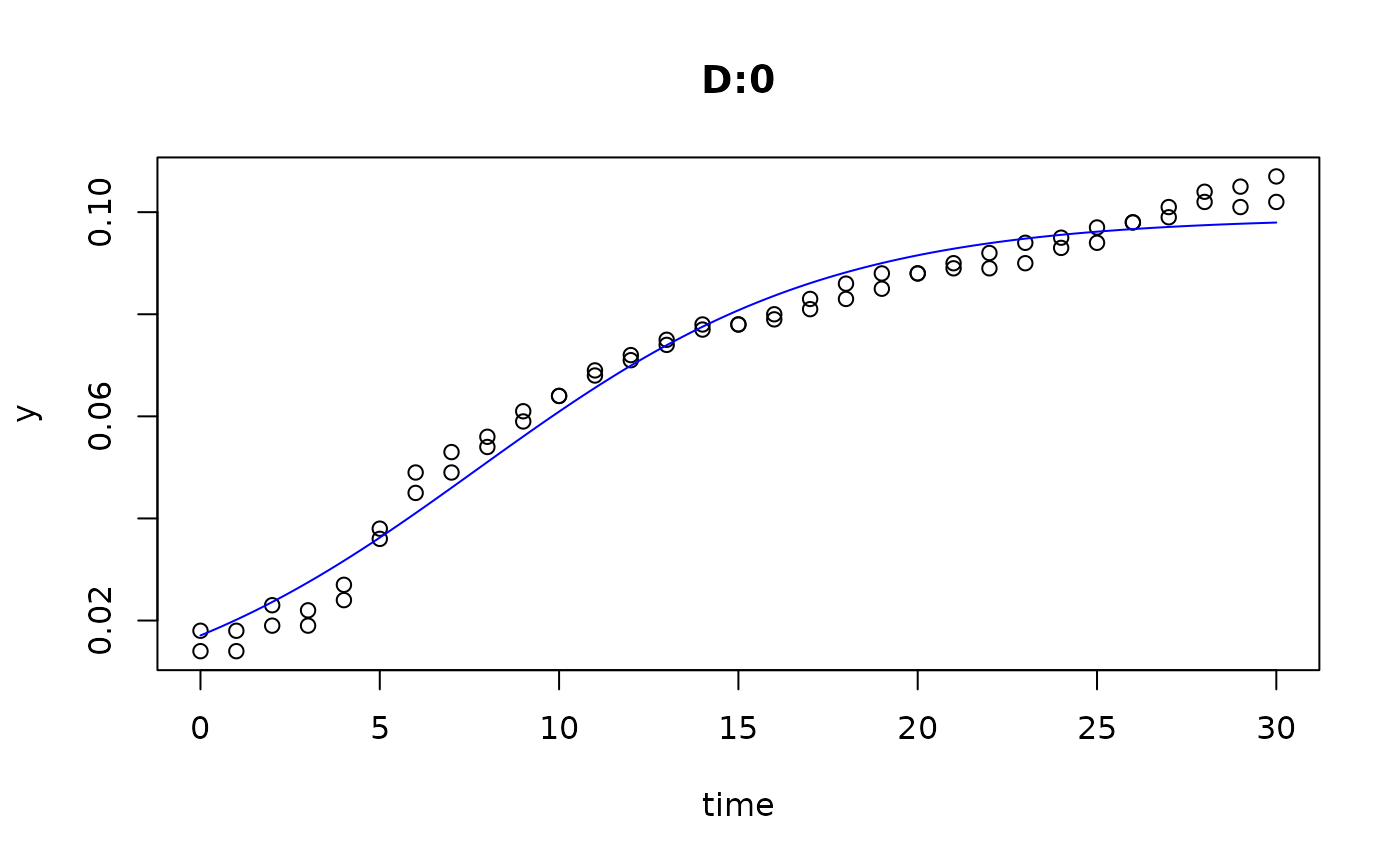
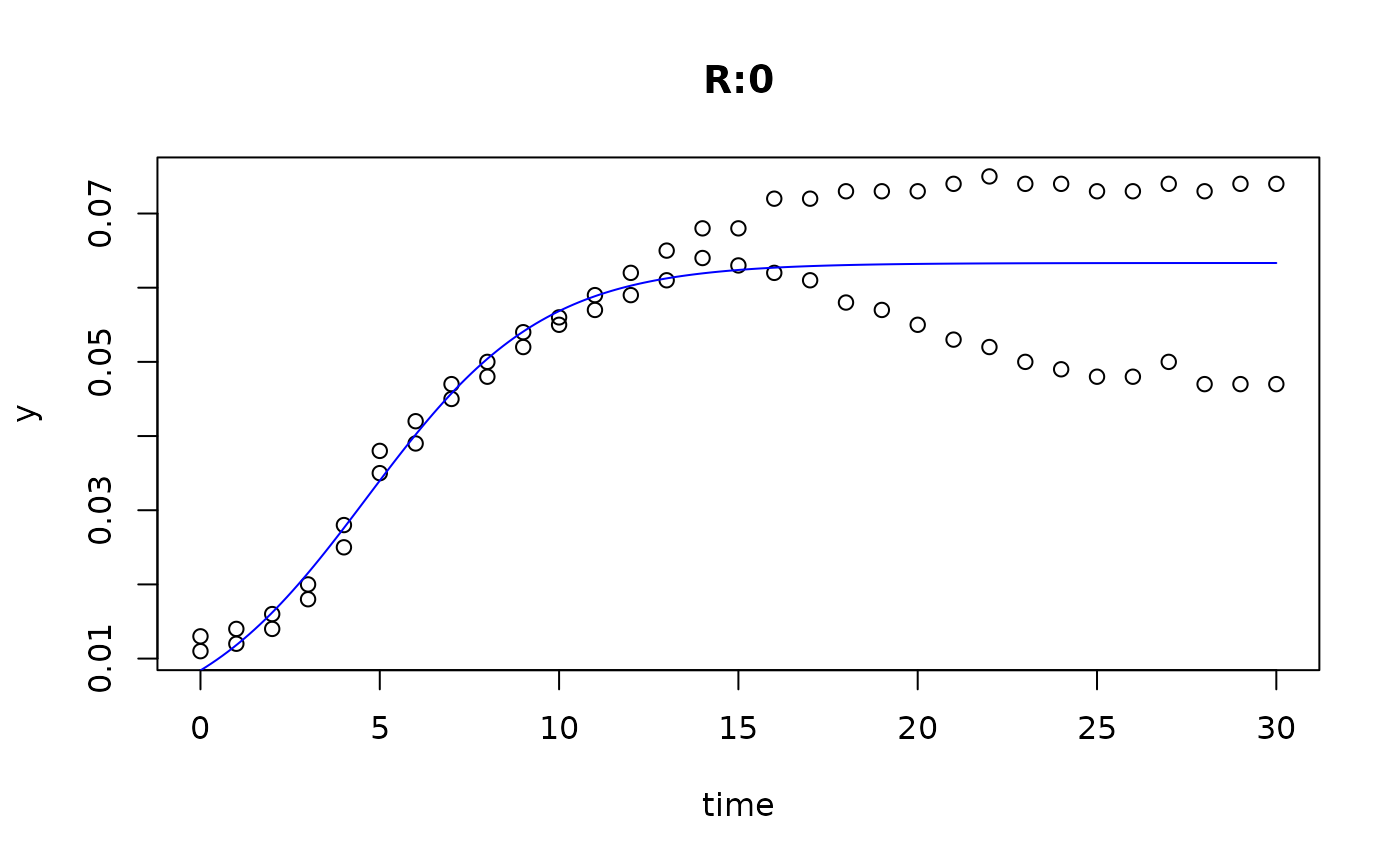
 fit5 <- all_growthmodels(
value ~ grow_logistic(time, parms) | strain + conc,
data = bactgrowth, p = p, lower = lower, ncores = 2)
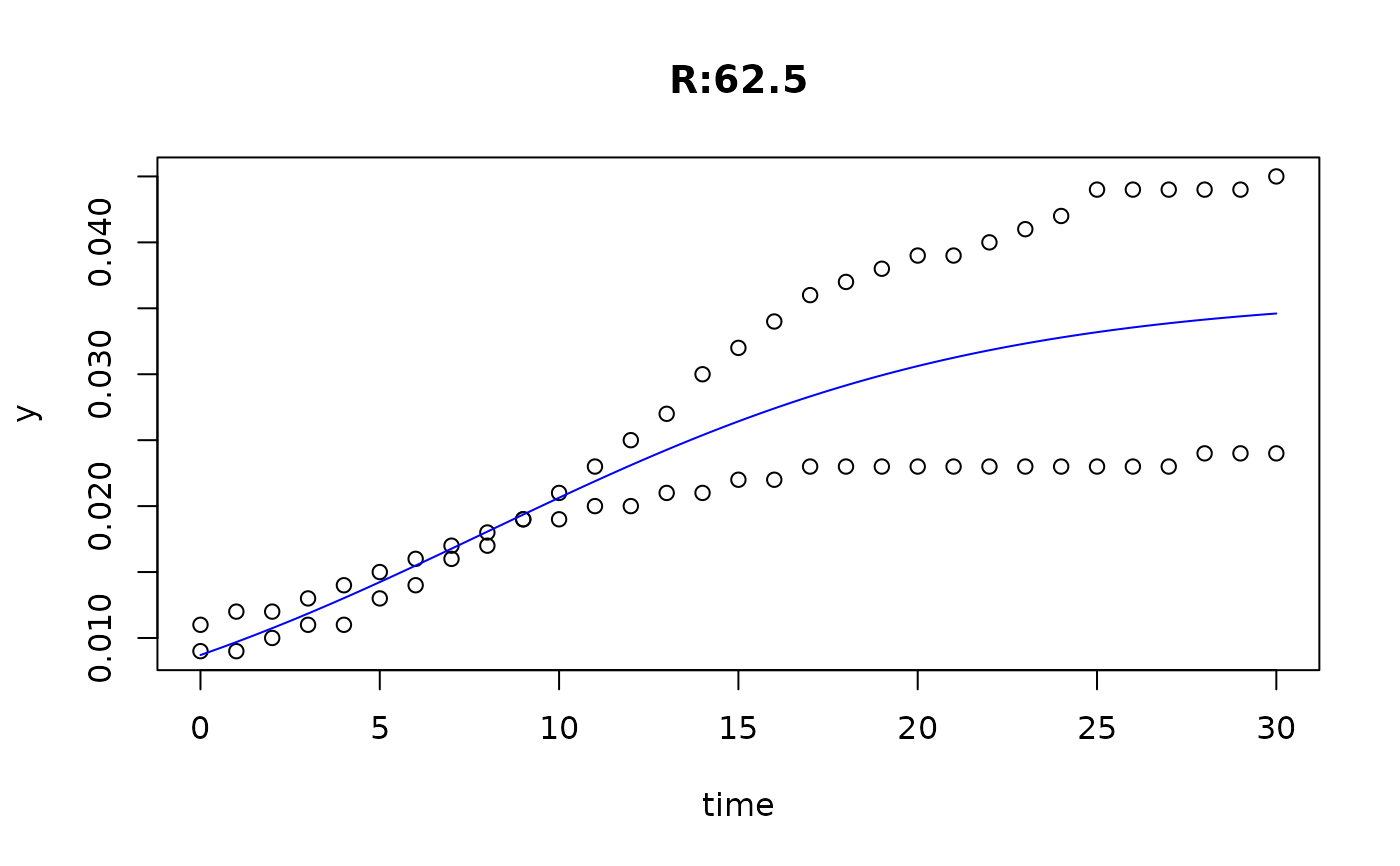
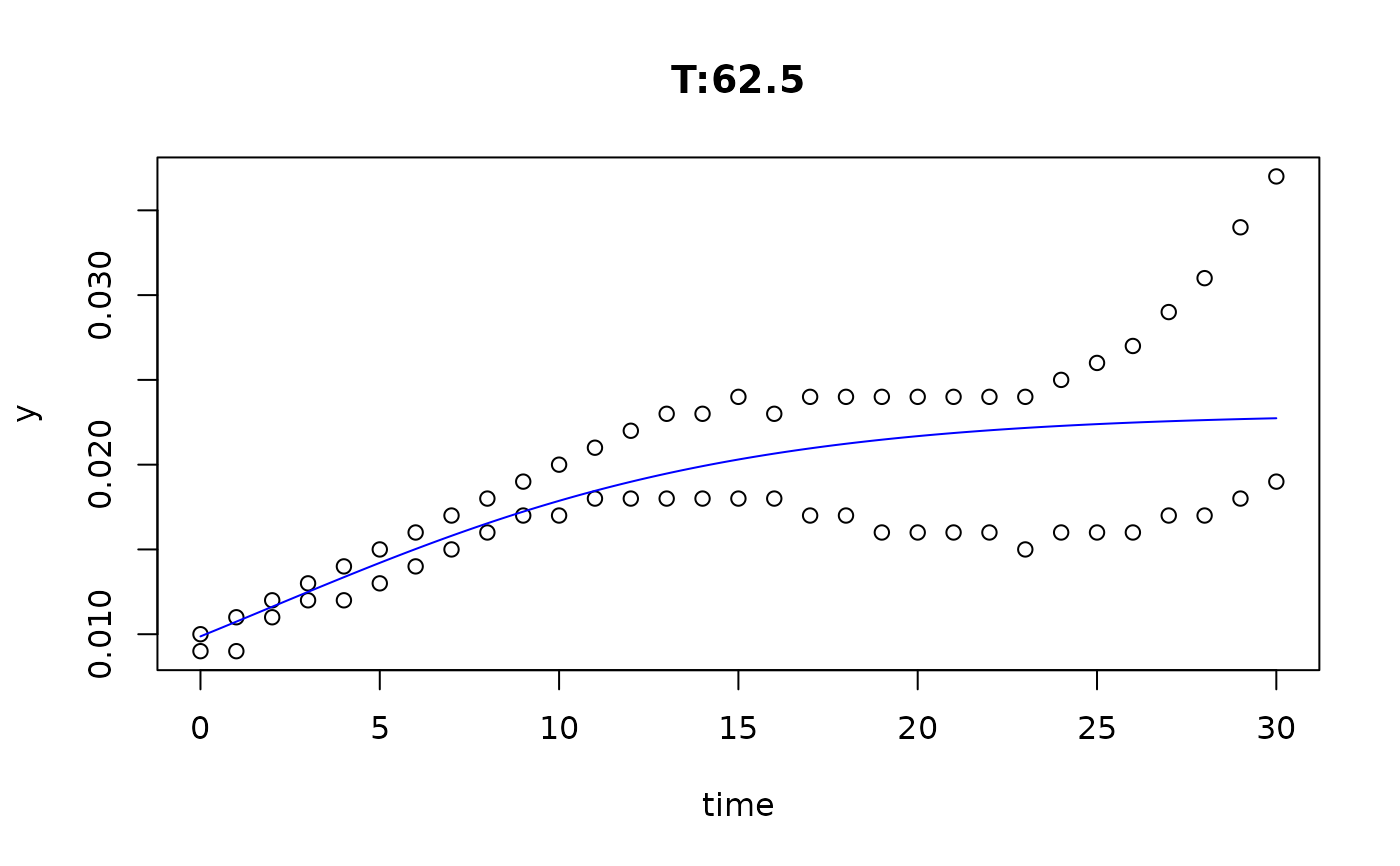
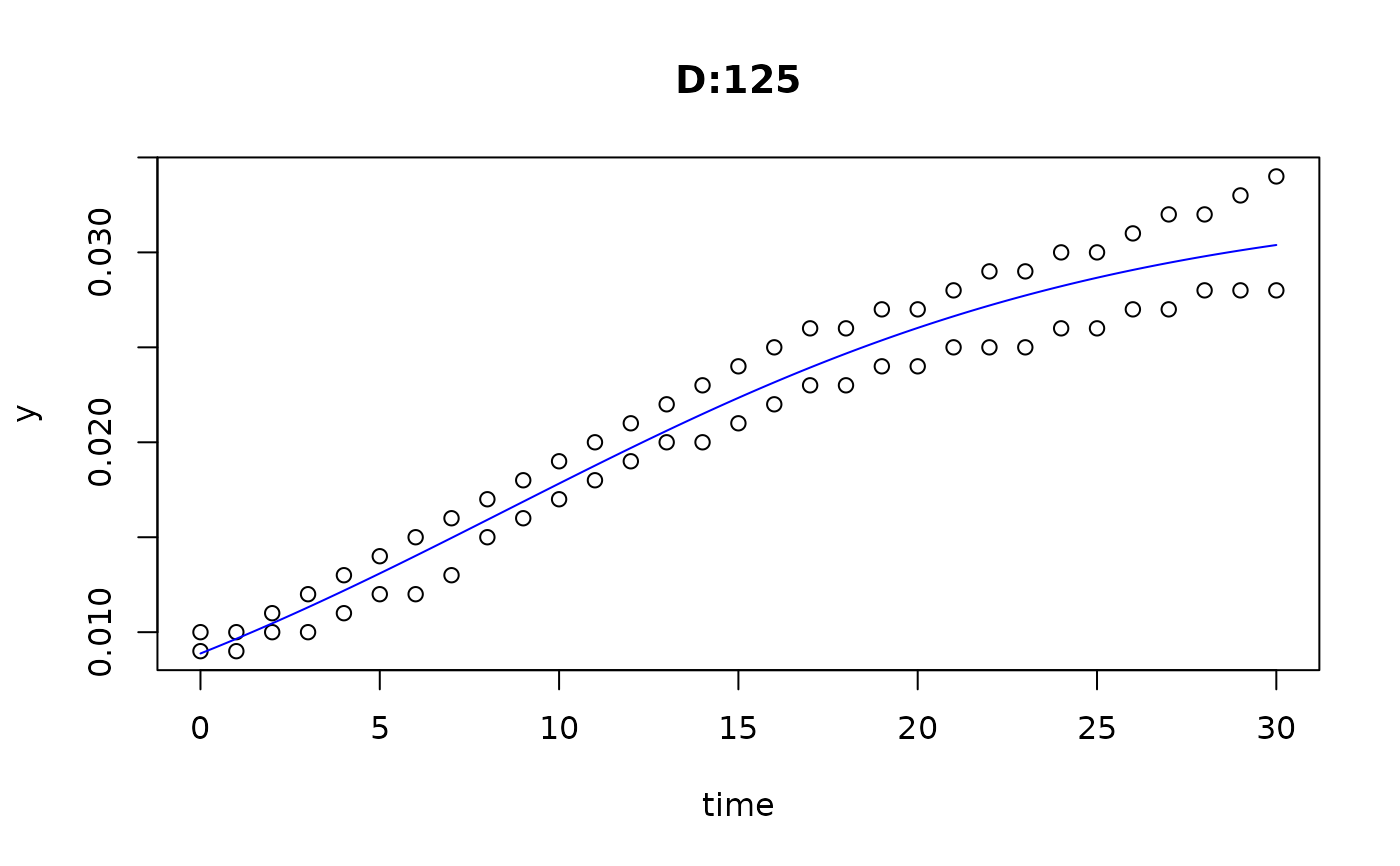
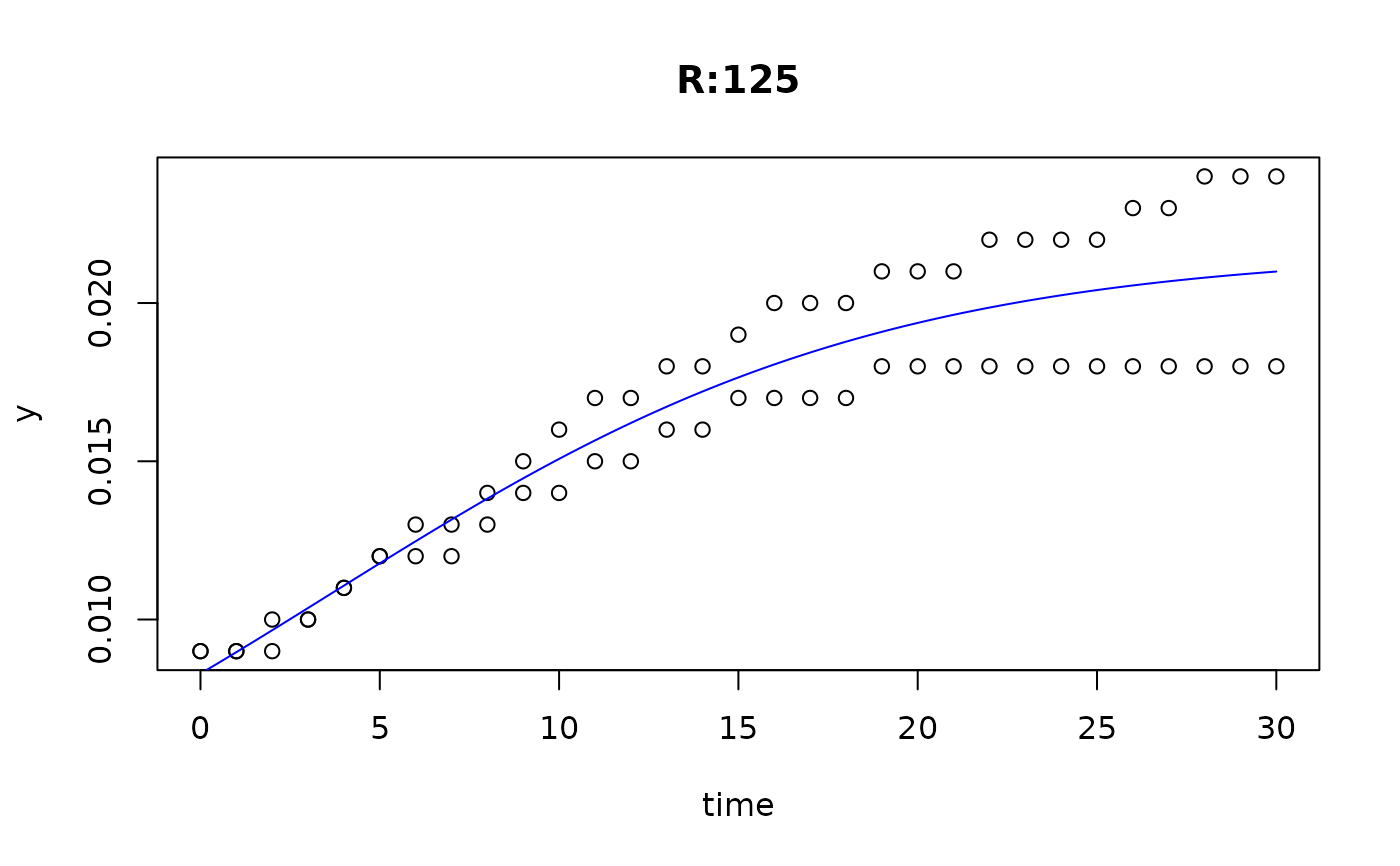
plot(fit5)
fit5 <- all_growthmodels(
value ~ grow_logistic(time, parms) | strain + conc,
data = bactgrowth, p = p, lower = lower, ncores = 2)
plot(fit5)


 # }
# }