Determine maximum growth rates from log-linear part of the growth curve for a series of experiments.
Usage
all_easylinear(...)

# S3 method for class 'formula'
all_easylinear(formula, data, h = 5, quota = 0.95, subset = NULL, ...)

# S3 method for class 'data.frame'
all_easylinear(
  data,
  grouping,
  time = "time",
  y = "value",
  h = 5,
  quota = 0.95,
  ...
)
Arguments
- ...
generic parameters, reserved for future extensions.
- formula
model formula specifying dependent, independent and grouping variables in the form:
dependent ~ independent | group1 + group2 + ....- data
data frame of observational data.
- h
with of the window (number of data).
- quota
part of window fits considered for the overall linear fit (relative to max. growth rate).
- subset
a specification of the rows to be used: defaults to all rows.
- grouping
model formula or character vector of criteria defining subsets in the data frame.
- time
character vectors with name independent variabl.e.
- y
character vector with name of dependent variable
References
Hall, BG., Acar, H, Nandipati, A and Barlow, M (2014) Growth Rates Made Easy. Mol. Biol. Evol. 31: 232-38, doi:10.1093/molbev/mst187
See also
Other fitting functions:
all_growthmodels(),
all_splines(),
fit_easylinear(),
fit_growthmodel(),
fit_spline()
Examples
# \donttest{
library("growthrates")
L <- all_easylinear(value ~ time | strain + conc + replicate, data=bactgrowth)
summary(L)
#> $`D:0:1`
#>
#> Call:
#> lm(formula = y ~ x)
#>
#> Residuals:
#> 1 2 3 4 5 6
#> 0.02113 -0.03716 -0.03727 0.04552 0.06376 -0.05598
#>
#> Coefficients:
#> Estimate Std. Error t value Pr(>|t|)
#> (Intercept) -4.39425 0.06429 -68.35 2.74e-07 ***
#> x 0.20490 0.01336 15.34 0.000105 ***
#> ---
#> Signif. codes: 0 ‘***’ 0.001 ‘**’ 0.01 ‘*’ 0.05 ‘.’ 0.1 ‘ ’ 1
#>
#> Residual standard error: 0.05587 on 4 degrees of freedom
#> Multiple R-squared: 0.9833, Adjusted R-squared: 0.9791
#> F-statistic: 235.3 on 1 and 4 DF, p-value: 0.0001053
#>
#>
#> $`R:0:1`
#>
#> Call:
#> lm(formula = y ~ x)
#>
#> Residuals:
#> 1 2 3 4 5 6
#> 0.05031 -0.05184 -0.05683 0.01537 0.09554 -0.05255
#>
#> Coefficients:
#> Estimate Std. Error t value Pr(>|t|)
#> (Intercept) -4.72947 0.06677 -70.84 2.38e-07 ***
#> x 0.25630 0.01714 14.95 0.000117 ***
#> ---
#> Signif. codes: 0 ‘***’ 0.001 ‘**’ 0.01 ‘*’ 0.05 ‘.’ 0.1 ‘ ’ 1
#>
#> Residual standard error: 0.07172 on 4 degrees of freedom
#> Multiple R-squared: 0.9824, Adjusted R-squared: 0.978
#> F-statistic: 223.5 on 1 and 4 DF, p-value: 0.0001166
#>
#>
#> $`T:0:1`
#>
#> Call:
#> lm(formula = y ~ x)
#>
#> Residuals:
#> 1 2 3 4 5
#> -0.001025 -0.002789 -0.027026 0.066520 -0.035679
#>
#> Coefficients:
#> Estimate Std. Error t value Pr(>|t|)
#> (Intercept) -5.13267 0.06215 -82.59 3.91e-06 ***
#> x 0.31192 0.01465 21.29 0.000227 ***
#> ---
#> Signif. codes: 0 ‘***’ 0.001 ‘**’ 0.01 ‘*’ 0.05 ‘.’ 0.1 ‘ ’ 1
#>
#> Residual standard error: 0.04632 on 3 degrees of freedom
#> Multiple R-squared: 0.9934, Adjusted R-squared: 0.9912
#> F-statistic: 453.4 on 1 and 3 DF, p-value: 0.0002266
#>
#>
#> $`D:0.24:1`
#>
#> Call:
#> lm(formula = y ~ x)
#>
#> Residuals:
#> 1 2 3 4 5
#> -7.669e-05 -1.408e-02 -3.848e-04 4.333e-02 -2.878e-02
#>
#> Coefficients:
#> Estimate Std. Error t value Pr(>|t|)
#> (Intercept) -4.21928 0.05113 -82.52 3.92e-06 ***
#> x 0.18990 0.00984 19.30 0.000304 ***
#> ---
#> Signif. codes: 0 ‘***’ 0.001 ‘**’ 0.01 ‘*’ 0.05 ‘.’ 0.1 ‘ ’ 1
#>
#> Residual standard error: 0.03112 on 3 degrees of freedom
#> Multiple R-squared: 0.992, Adjusted R-squared: 0.9893
#> F-statistic: 372.4 on 1 and 3 DF, p-value: 0.0003039
#>
#>
#> $`R:0.24:1`
#>
#> Call:
#> lm(formula = y ~ x)
#>
#> Residuals:
#> 1 2 3 4 5 6
#> 0.001099 -0.011307 0.012425 -0.004436 0.011329 -0.009110
#>
#> Coefficients:
#> Estimate Std. Error t value Pr(>|t|)
#> (Intercept) -4.263086 0.034202 -124.64 2.48e-08 ***
#> x 0.053229 0.002711 19.63 3.97e-05 ***
#> ---
#> Signif. codes: 0 ‘***’ 0.001 ‘**’ 0.01 ‘*’ 0.05 ‘.’ 0.1 ‘ ’ 1
#>
#> Residual standard error: 0.01134 on 4 degrees of freedom
#> Multiple R-squared: 0.9897, Adjusted R-squared: 0.9872
#> F-statistic: 385.5 on 1 and 4 DF, p-value: 3.968e-05
#>
#>
#> $`T:0.24:1`
#>
#> Call:
#> lm(formula = y ~ x)
#>
#> Residuals:
#> 1 2 3 4 5 6
#> 0.05437 -0.05759 -0.05606 0.02914 0.06841 -0.03827
#>
#> Coefficients:
#> Estimate Std. Error t value Pr(>|t|)
#> (Intercept) -4.44178 0.07370 -60.27 4.54e-07 ***
#> x 0.21205 0.01531 13.85 0.000158 ***
#> ---
#> Signif. codes: 0 ‘***’ 0.001 ‘**’ 0.01 ‘*’ 0.05 ‘.’ 0.1 ‘ ’ 1
#>
#> Residual standard error: 0.06405 on 4 degrees of freedom
#> Multiple R-squared: 0.9796, Adjusted R-squared: 0.9745
#> F-statistic: 191.8 on 1 and 4 DF, p-value: 0.0001576
#>
#>
#> $`D:0.49:1`
#>
#> Call:
#> lm(formula = y ~ x)
#>
#> Residuals:
#> 1 2 3 4 5 6
#> 0.02771 -0.05023 -0.05527 0.10339 0.02140 -0.04700
#>
#> Coefficients:
#> Estimate Std. Error t value Pr(>|t|)
#> (Intercept) -3.67930 0.08075 -45.564 1.39e-06 ***
#> x 0.13510 0.01678 8.052 0.00129 **
#> ---
#> Signif. codes: 0 ‘***’ 0.001 ‘**’ 0.01 ‘*’ 0.05 ‘.’ 0.1 ‘ ’ 1
#>
#> Residual standard error: 0.07018 on 4 degrees of freedom
#> Multiple R-squared: 0.9419, Adjusted R-squared: 0.9274
#> F-statistic: 64.84 on 1 and 4 DF, p-value: 0.001291
#>
#>
#> $`R:0.49:1`
#>
#> Call:
#> lm(formula = y ~ x)
#>
#> Residuals:
#> Min 1Q Median 3Q Max
#> -0.011759 -0.008320 0.001372 0.008141 0.009857
#>
#> Coefficients:
#> Estimate Std. Error t value Pr(>|t|)
#> (Intercept) -4.949090 0.012094 -409.23 1.44e-14 ***
#> x 0.134500 0.001542 87.22 1.53e-10 ***
#> ---
#> Signif. codes: 0 ‘***’ 0.001 ‘**’ 0.01 ‘*’ 0.05 ‘.’ 0.1 ‘ ’ 1
#>
#> Residual standard error: 0.009994 on 6 degrees of freedom
#> Multiple R-squared: 0.9992, Adjusted R-squared: 0.9991
#> F-statistic: 7607 on 1 and 6 DF, p-value: 1.53e-10
#>
#>
#> $`T:0.49:1`
#>
#> Call:
#> lm(formula = y ~ x)
#>
#> Residuals:
#> 1 2 3 4 5
#> 0.003371 -0.019480 -0.008315 0.061583 -0.037160
#>
#> Coefficients:
#> Estimate Std. Error t value Pr(>|t|)
#> (Intercept) -4.92841 0.05814 -84.77 3.62e-06 ***
#> x 0.29112 0.01370 21.24 0.000228 ***
#> ---
#> Signif. codes: 0 ‘***’ 0.001 ‘**’ 0.01 ‘*’ 0.05 ‘.’ 0.1 ‘ ’ 1
#>
#> Residual standard error: 0.04333 on 3 degrees of freedom
#> Multiple R-squared: 0.9934, Adjusted R-squared: 0.9912
#> F-statistic: 451.3 on 1 and 3 DF, p-value: 0.0002282
#>
#>
#> $`D:0.98:1`
#>
#> Call:
#> lm(formula = y ~ x)
#>
#> Residuals:
#> 1 2 3 4 5
#> 0.03455 -0.05987 -0.04096 0.12332 -0.05704
#>
#> Coefficients:
#> Estimate Std. Error t value Pr(>|t|)
#> (Intercept) -5.09252 0.12227 -41.65 3.05e-05 ***
#> x 0.31756 0.02882 11.02 0.0016 **
#> ---
#> Signif. codes: 0 ‘***’ 0.001 ‘**’ 0.01 ‘*’ 0.05 ‘.’ 0.1 ‘ ’ 1
#>
#> Residual standard error: 0.09113 on 3 degrees of freedom
#> Multiple R-squared: 0.9759, Adjusted R-squared: 0.9679
#> F-statistic: 121.4 on 1 and 3 DF, p-value: 0.001601
#>
#>
#> $`R:0.98:1`
#>
#> Call:
#> lm(formula = y ~ x)
#>
#> Residuals:
#> 1 2 3 4 5 6
#> 0.008955 -0.017095 0.013025 -0.024859 0.034249 -0.014274
#>
#> Coefficients:
#> Estimate Std. Error t value Pr(>|t|)
#> (Intercept) -4.94295 0.05811 -85.07 1.14e-07 ***
#> x 0.09504 0.00602 15.79 9.40e-05 ***
#> ---
#> Signif. codes: 0 ‘***’ 0.001 ‘**’ 0.01 ‘*’ 0.05 ‘.’ 0.1 ‘ ’ 1
#>
#> Residual standard error: 0.02518 on 4 degrees of freedom
#> Multiple R-squared: 0.9842, Adjusted R-squared: 0.9803
#> F-statistic: 249.3 on 1 and 4 DF, p-value: 9.404e-05
#>
#>
#> $`T:0.98:1`
#>
#> Call:
#> lm(formula = y ~ x)
#>
#> Residuals:
#> 1 2 3 4 5 6
#> 0.07048 -0.02981 -0.08960 -0.03388 0.10342 -0.02060
#>
#> Coefficients:
#> Estimate Std. Error t value Pr(>|t|)
#> (Intercept) -5.08196 0.07527 -67.51 2.88e-07 ***
#> x 0.30095 0.01933 15.57 9.93e-05 ***
#> ---
#> Signif. codes: 0 ‘***’ 0.001 ‘**’ 0.01 ‘*’ 0.05 ‘.’ 0.1 ‘ ’ 1
#>
#> Residual standard error: 0.08086 on 4 degrees of freedom
#> Multiple R-squared: 0.9838, Adjusted R-squared: 0.9797
#> F-statistic: 242.4 on 1 and 4 DF, p-value: 9.933e-05
#>
#>
#> $`D:1.95:1`
#>
#> Call:
#> lm(formula = y ~ x)
#>
#> Residuals:
#> 1 2 3 4 5
#> 0.03961 -0.06832 -0.06293 0.17238 -0.08074
#>
#> Coefficients:
#> Estimate Std. Error t value Pr(>|t|)
#> (Intercept) -5.12463 0.16691 -30.703 7.59e-05 ***
#> x 0.33108 0.03934 8.416 0.00352 **
#> ---
#> Signif. codes: 0 ‘***’ 0.001 ‘**’ 0.01 ‘*’ 0.05 ‘.’ 0.1 ‘ ’ 1
#>
#> Residual standard error: 0.1244 on 3 degrees of freedom
#> Multiple R-squared: 0.9594, Adjusted R-squared: 0.9458
#> F-statistic: 70.82 on 1 and 3 DF, p-value: 0.00352
#>
#>
#> $`R:1.95:1`
#>
#> Call:
#> lm(formula = y ~ x)
#>
#> Residuals:
#> Min 1Q Median 3Q Max
#> -0.017386 -0.009382 0.003171 0.004679 0.021066
#>
#> Coefficients:
#> Estimate Std. Error t value Pr(>|t|)
#> (Intercept) -5.011950 0.022290 -224.85 5.22e-13 ***
#> x 0.095080 0.002074 45.84 7.22e-09 ***
#> ---
#> Signif. codes: 0 ‘***’ 0.001 ‘**’ 0.01 ‘*’ 0.05 ‘.’ 0.1 ‘ ’ 1
#>
#> Residual standard error: 0.01344 on 6 degrees of freedom
#> Multiple R-squared: 0.9972, Adjusted R-squared: 0.9967
#> F-statistic: 2101 on 1 and 6 DF, p-value: 7.219e-09
#>
#>
#> $`T:1.95:1`
#>
#> Call:
#> lm(formula = y ~ x)
#>
#> Residuals:
#> 1 2 3 4 5 6
#> 0.07448 -0.03023 -0.09412 -0.04469 0.12026 -0.02570
#>
#> Coefficients:
#> Estimate Std. Error t value Pr(>|t|)
#> (Intercept) -4.96669 0.08384 -59.24 4.86e-07 ***
#> x 0.28704 0.02153 13.33 0.000183 ***
#> ---
#> Signif. codes: 0 ‘***’ 0.001 ‘**’ 0.01 ‘*’ 0.05 ‘.’ 0.1 ‘ ’ 1
#>
#> Residual standard error: 0.09006 on 4 degrees of freedom
#> Multiple R-squared: 0.978, Adjusted R-squared: 0.9725
#> F-statistic: 177.8 on 1 and 4 DF, p-value: 0.0001829
#>
#>
#> $`D:3.91:1`
#>
#> Call:
#> lm(formula = y ~ x)
#>
#> Residuals:
#> 1 2 3 4 5
#> 0.04145 -0.05891 -0.04846 0.10785 -0.04193
#>
#> Coefficients:
#> Estimate Std. Error t value Pr(>|t|)
#> (Intercept) -5.00026 0.11205 -44.62 2.48e-05 ***
#> x 0.30800 0.02641 11.66 0.00135 **
#> ---
#> Signif. codes: 0 ‘***’ 0.001 ‘**’ 0.01 ‘*’ 0.05 ‘.’ 0.1 ‘ ’ 1
#>
#> Residual standard error: 0.08352 on 3 degrees of freedom
#> Multiple R-squared: 0.9784, Adjusted R-squared: 0.9712
#> F-statistic: 136 on 1 and 3 DF, p-value: 0.001355
#>
#>
#> $`R:3.91:1`
#>
#> Call:
#> lm(formula = y ~ x)
#>
#> Residuals:
#> 1 2 3 4 5 6
#> 0.0071323 -0.0137318 0.0160051 -0.0141904 -0.0003689 0.0051537
#>
#> Coefficients:
#> Estimate Std. Error t value Pr(>|t|)
#> (Intercept) -4.875698 0.037381 -130.43 2.07e-08 ***
#> x 0.081489 0.003215 25.34 1.44e-05 ***
#> ---
#> Signif. codes: 0 ‘***’ 0.001 ‘**’ 0.01 ‘*’ 0.05 ‘.’ 0.1 ‘ ’ 1
#>
#> Residual standard error: 0.01345 on 4 degrees of freedom
#> Multiple R-squared: 0.9938, Adjusted R-squared: 0.9923
#> F-statistic: 642.3 on 1 and 4 DF, p-value: 1.439e-05
#>
#>
#> $`T:3.91:1`
#>
#> Call:
#> lm(formula = y ~ x)
#>
#> Residuals:
#> 1 2 3 4 5 6
#> 0.056140 -0.041372 -0.033524 -0.041424 0.068207 -0.008028
#>
#> Coefficients:
#> Estimate Std. Error t value Pr(>|t|)
#> (Intercept) -4.94114 0.05187 -95.25 7.28e-08 ***
#> x 0.27983 0.01332 21.01 3.03e-05 ***
#> ---
#> Signif. codes: 0 ‘***’ 0.001 ‘**’ 0.01 ‘*’ 0.05 ‘.’ 0.1 ‘ ’ 1
#>
#> Residual standard error: 0.05572 on 4 degrees of freedom
#> Multiple R-squared: 0.991, Adjusted R-squared: 0.9888
#> F-statistic: 441.4 on 1 and 4 DF, p-value: 3.034e-05
#>
#>
#> $`D:7.81:1`
#>
#> Call:
#> lm(formula = y ~ x)
#>
#> Residuals:
#> 1 2 3 4 5
#> 0.04370 -0.06193 -0.06219 0.13537 -0.05495
#>
#> Coefficients:
#> Estimate Std. Error t value Pr(>|t|)
#> (Intercept) -4.81930 0.13628 -35.362 4.97e-05 ***
#> x 0.28795 0.03212 8.964 0.00293 **
#> ---
#> Signif. codes: 0 ‘***’ 0.001 ‘**’ 0.01 ‘*’ 0.05 ‘.’ 0.1 ‘ ’ 1
#>
#> Residual standard error: 0.1016 on 3 degrees of freedom
#> Multiple R-squared: 0.964, Adjusted R-squared: 0.952
#> F-statistic: 80.36 on 1 and 3 DF, p-value: 0.00293
#>
#>
#> $`R:7.81:1`
#>
#> Call:
#> lm(formula = y ~ x)
#>
#> Residuals:
#> Min 1Q Median 3Q Max
#> -0.016088 -0.008101 0.002653 0.005409 0.019049
#>
#> Coefficients:
#> Estimate Std. Error t value Pr(>|t|)
#> (Intercept) -4.90382 0.02074 -236.46 3.86e-13 ***
#> x 0.09002 0.00193 46.65 6.50e-09 ***
#> ---
#> Signif. codes: 0 ‘***’ 0.001 ‘**’ 0.01 ‘*’ 0.05 ‘.’ 0.1 ‘ ’ 1
#>
#> Residual standard error: 0.01251 on 6 degrees of freedom
#> Multiple R-squared: 0.9973, Adjusted R-squared: 0.9968
#> F-statistic: 2176 on 1 and 6 DF, p-value: 6.5e-09
#>
#>
#> $`T:7.81:1`
#>
#> Call:
#> lm(formula = y ~ x)
#>
#> Residuals:
#> 1 2 3 4 5
#> 0.03653 -0.03329 -0.09296 0.13967 -0.04995
#>
#> Coefficients:
#> Estimate Std. Error t value Pr(>|t|)
#> (Intercept) -5.16836 0.14090 -36.681 4.46e-05 ***
#> x 0.31098 0.03321 9.364 0.00258 **
#> ---
#> Signif. codes: 0 ‘***’ 0.001 ‘**’ 0.01 ‘*’ 0.05 ‘.’ 0.1 ‘ ’ 1
#>
#> Residual standard error: 0.105 on 3 degrees of freedom
#> Multiple R-squared: 0.9669, Adjusted R-squared: 0.9559
#> F-statistic: 87.69 on 1 and 3 DF, p-value: 0.002579
#>
#>
#> $`D:15.63:1`
#>
#> Call:
#> lm(formula = y ~ x)
#>
#> Residuals:
#> 1 2 3 4 5 6
#> 0.03819 -0.08467 -0.06913 0.18531 -0.01552 -0.05419
#>
#> Coefficients:
#> Estimate Std. Error t value Pr(>|t|)
#> (Intercept) -4.81968 0.12982 -37.127 3.14e-06 ***
#> x 0.25639 0.02697 9.506 0.000684 ***
#> ---
#> Signif. codes: 0 ‘***’ 0.001 ‘**’ 0.01 ‘*’ 0.05 ‘.’ 0.1 ‘ ’ 1
#>
#> Residual standard error: 0.1128 on 4 degrees of freedom
#> Multiple R-squared: 0.9576, Adjusted R-squared: 0.947
#> F-statistic: 90.37 on 1 and 4 DF, p-value: 0.0006835
#>
#>
#> $`R:15.63:1`
#>
#> Call:
#> lm(formula = y ~ x)
#>
#> Residuals:
#> 1 2 3 4 5 6
#> -0.0008624 -0.0009698 -0.0111276 0.0112378 0.0190986 -0.0173765
#>
#> Coefficients:
#> Estimate Std. Error t value Pr(>|t|)
#> (Intercept) -5.071201 0.045700 -110.97 3.95e-08 ***
#> x 0.105468 0.003622 29.12 8.28e-06 ***
#> ---
#> Signif. codes: 0 ‘***’ 0.001 ‘**’ 0.01 ‘*’ 0.05 ‘.’ 0.1 ‘ ’ 1
#>
#> Residual standard error: 0.01515 on 4 degrees of freedom
#> Multiple R-squared: 0.9953, Adjusted R-squared: 0.9941
#> F-statistic: 847.7 on 1 and 4 DF, p-value: 8.284e-06
#>
#>
#> $`T:15.63:1`
#>
#> Call:
#> lm(formula = y ~ x)
#>
#> Residuals:
#> 1 2 3 4 5 6
#> -0.025215 -0.068095 0.180830 -0.062721 -0.018590 -0.006208
#>
#> Coefficients:
#> Estimate Std. Error t value Pr(>|t|)
#> (Intercept) -5.41597 0.14155 -38.261 2.79e-06 ***
#> x 0.24355 0.02458 9.909 0.000582 ***
#> ---
#> Signif. codes: 0 ‘***’ 0.001 ‘**’ 0.01 ‘*’ 0.05 ‘.’ 0.1 ‘ ’ 1
#>
#> Residual standard error: 0.1028 on 4 degrees of freedom
#> Multiple R-squared: 0.9609, Adjusted R-squared: 0.9511
#> F-statistic: 98.18 on 1 and 4 DF, p-value: 0.0005823
#>
#>
#> $`D:31.25:1`
#>
#> Call:
#> lm(formula = y ~ x)
#>
#> Residuals:
#> 1 2 3 4 5 6
#> 0.039057 -0.032029 -0.031757 -0.005204 0.038508 -0.008576
#>
#> Coefficients:
#> Estimate Std. Error t value Pr(>|t|)
#> (Intercept) -5.522745 0.082737 -66.75 3.02e-07 ***
#> x 0.238139 0.008572 27.78 9.99e-06 ***
#> ---
#> Signif. codes: 0 ‘***’ 0.001 ‘**’ 0.01 ‘*’ 0.05 ‘.’ 0.1 ‘ ’ 1
#>
#> Residual standard error: 0.03586 on 4 degrees of freedom
#> Multiple R-squared: 0.9948, Adjusted R-squared: 0.9936
#> F-statistic: 771.8 on 1 and 4 DF, p-value: 9.985e-06
#>
#>
#> $`R:31.25:1`
#>
#> Call:
#> lm(formula = y ~ x)
#>
#> Residuals:
#> 1 2 3 4 5 6
#> 0.0035192 -0.0193741 0.0294765 -0.0146190 0.0007089 0.0002885
#>
#> Coefficients:
#> Estimate Std. Error t value Pr(>|t|)
#> (Intercept) -4.963300 0.026399 -188.01 4.80e-09 ***
#> x 0.118203 0.004584 25.79 1.34e-05 ***
#> ---
#> Signif. codes: 0 ‘***’ 0.001 ‘**’ 0.01 ‘*’ 0.05 ‘.’ 0.1 ‘ ’ 1
#>
#> Residual standard error: 0.01918 on 4 degrees of freedom
#> Multiple R-squared: 0.994, Adjusted R-squared: 0.9925
#> F-statistic: 664.9 on 1 and 4 DF, p-value: 1.344e-05
#>
#>
#> $`T:31.25:1`
#>
#> Call:
#> lm(formula = y ~ x)
#>
#> Residuals:
#> 1 2 3 4 5 6 7
#> 0.032700 -0.032491 -0.024069 0.008003 0.017211 0.004100 -0.005454
#>
#> Coefficients:
#> Estimate Std. Error t value Pr(>|t|)
#> (Intercept) -6.667356 0.066666 -100.01 1.89e-09 ***
#> x 0.247512 0.004714 52.51 4.74e-08 ***
#> ---
#> Signif. codes: 0 ‘***’ 0.001 ‘**’ 0.01 ‘*’ 0.05 ‘.’ 0.1 ‘ ’ 1
#>
#> Residual standard error: 0.02494 on 5 degrees of freedom
#> Multiple R-squared: 0.9982, Adjusted R-squared: 0.9978
#> F-statistic: 2757 on 1 and 5 DF, p-value: 4.738e-08
#>
#>
#> $`D:62.5:1`
#>
#> Call:
#> lm(formula = y ~ x)
#>
#> Residuals:
#> 1 2 3 4 5 6
#> 0.01034 -0.00617 -0.01032 -0.00669 0.01731 -0.00447
#>
#> Coefficients:
#> Estimate Std. Error t value Pr(>|t|)
#> (Intercept) -5.423423 0.063975 -84.77 1.16e-07 ***
#> x 0.114152 0.002966 38.48 2.72e-06 ***
#> ---
#> Signif. codes: 0 ‘***’ 0.001 ‘**’ 0.01 ‘*’ 0.05 ‘.’ 0.1 ‘ ’ 1
#>
#> Residual standard error: 0.01241 on 4 degrees of freedom
#> Multiple R-squared: 0.9973, Adjusted R-squared: 0.9966
#> F-statistic: 1481 on 1 and 4 DF, p-value: 2.723e-06
#>
#>
#> $`R:62.5:1`
#>
#> Call:
#> lm(formula = y ~ x)
#>
#> Residuals:
#> 1 2 3 4 5
#> -0.027990 0.031236 -0.002483 0.023220 -0.023983
#>
#> Coefficients:
#> Estimate Std. Error t value Pr(>|t|)
#> (Intercept) -4.913180 0.060395 -81.35 4.09e-06 ***
#> x 0.107828 0.009797 11.01 0.00161 **
#> ---
#> Signif. codes: 0 ‘***’ 0.001 ‘**’ 0.01 ‘*’ 0.05 ‘.’ 0.1 ‘ ’ 1
#>
#> Residual standard error: 0.03098 on 3 degrees of freedom
#> Multiple R-squared: 0.9758, Adjusted R-squared: 0.9678
#> F-statistic: 121.1 on 1 and 3 DF, p-value: 0.001606
#>
#>
#> $`T:62.5:1`
#>
#> Call:
#> lm(formula = y ~ x)
#>
#> Residuals:
#> 1 2 3 4 5 6
#> 0.008565 -0.071112 0.049882 0.057217 -0.022459 -0.022093
#>
#> Coefficients:
#> Estimate Std. Error t value Pr(>|t|)
#> (Intercept) -4.71910 0.03945 -119.620 2.93e-08 ***
#> x 0.07968 0.01303 6.115 0.00362 **
#> ---
#> Signif. codes: 0 ‘***’ 0.001 ‘**’ 0.01 ‘*’ 0.05 ‘.’ 0.1 ‘ ’ 1
#>
#> Residual standard error: 0.05451 on 4 degrees of freedom
#> Multiple R-squared: 0.9034, Adjusted R-squared: 0.8792
#> F-statistic: 37.39 on 1 and 4 DF, p-value: 0.003622
#>
#>
#> $`D:125:1`
#>
#> Call:
#> lm(formula = y ~ x)
#>
#> Residuals:
#> 1 2 3 4 5
#> -0.007294 0.004016 0.007028 0.003071 -0.006821
#>
#> Coefficients:
#> Estimate Std. Error t value Pr(>|t|)
#> (Intercept) -4.681876 0.008003 -585.01 1.10e-08 ***
#> x 0.084000 0.002413 34.81 5.21e-05 ***
#> ---
#> Signif. codes: 0 ‘***’ 0.001 ‘**’ 0.01 ‘*’ 0.05 ‘.’ 0.1 ‘ ’ 1
#>
#> Residual standard error: 0.007631 on 3 degrees of freedom
#> Multiple R-squared: 0.9975, Adjusted R-squared: 0.9967
#> F-statistic: 1212 on 1 and 3 DF, p-value: 5.212e-05
#>
#>
#> $`R:125:1`
#>
#> Call:
#> lm(formula = y ~ x)
#>
#> Residuals:
#> 1 2 3 4 5 6
#> 0.024298 -0.044181 -0.007299 0.019532 0.038064 -0.030415
#>
#> Coefficients:
#> Estimate Std. Error t value Pr(>|t|)
#> (Intercept) -4.803308 0.034050 -141.067 1.51e-08 ***
#> x 0.068479 0.008743 7.832 0.00143 **
#> ---
#> Signif. codes: 0 ‘***’ 0.001 ‘**’ 0.01 ‘*’ 0.05 ‘.’ 0.1 ‘ ’ 1
#>
#> Residual standard error: 0.03658 on 4 degrees of freedom
#> Multiple R-squared: 0.9388, Adjusted R-squared: 0.9235
#> F-statistic: 61.34 on 1 and 4 DF, p-value: 0.001435
#>
#>
#> $`T:125:1`
#>
#> Call:
#> lm(formula = y ~ x)
#>
#> Residuals:
#> 1 2 3 4 5
#> -0.006979 0.027046 -0.056712 0.060201 -0.023557
#>
#> Coefficients:
#> Estimate Std. Error t value Pr(>|t|)
#> (Intercept) -4.82133 0.04044 -119.233 1.3e-06 ***
#> x 0.08376 0.01651 5.074 0.0148 *
#> ---
#> Signif. codes: 0 ‘***’ 0.001 ‘**’ 0.01 ‘*’ 0.05 ‘.’ 0.1 ‘ ’ 1
#>
#> Residual standard error: 0.0522 on 3 degrees of freedom
#> Multiple R-squared: 0.8956, Adjusted R-squared: 0.8608
#> F-statistic: 25.74 on 1 and 3 DF, p-value: 0.01479
#>
#>
#> $`D:250:1`
#>
#> Call:
#> lm(formula = y ~ x)
#>
#> Residuals:
#> Min 1Q Median 3Q Max
#> -0.03254 -0.01583 -0.01115 0.01002 0.05562
#>
#> Coefficients:
#> Estimate Std. Error t value Pr(>|t|)
#> (Intercept) -4.385786 0.024929 -175.93 2.28e-12 ***
#> x 0.065001 0.004937 13.17 1.18e-05 ***
#> ---
#> Signif. codes: 0 ‘***’ 0.001 ‘**’ 0.01 ‘*’ 0.05 ‘.’ 0.1 ‘ ’ 1
#>
#> Residual standard error: 0.03199 on 6 degrees of freedom
#> Multiple R-squared: 0.9665, Adjusted R-squared: 0.961
#> F-statistic: 173.4 on 1 and 6 DF, p-value: 1.185e-05
#>
#>
#> $`R:250:1`
#>
#> Call:
#> lm(formula = y ~ x)
#>
#> Residuals:
#> 1 2 3 4 5
#> -0.01911 -0.01091 0.06034 -0.01151 -0.01881
#>
#> Coefficients:
#> Estimate Std. Error t value Pr(>|t|)
#> (Intercept) -4.40374 0.03037 -145.004 7.23e-07 ***
#> x 0.07185 0.01240 5.795 0.0102 *
#> ---
#> Signif. codes: 0 ‘***’ 0.001 ‘**’ 0.01 ‘*’ 0.05 ‘.’ 0.1 ‘ ’ 1
#>
#> Residual standard error: 0.03921 on 3 degrees of freedom
#> Multiple R-squared: 0.918, Adjusted R-squared: 0.8906
#> F-statistic: 33.58 on 1 and 3 DF, p-value: 0.01022
#>
#>
#> $`T:250:1`
#>
#> Call:
#> lm(formula = y ~ x)
#>
#> Residuals:
#> Min 1Q Median 3Q Max
#> -0.05531 -0.01591 0.01044 0.01500 0.05691
#>
#> Coefficients:
#> Estimate Std. Error t value Pr(>|t|)
#> (Intercept) -4.586043 0.030760 -149.1 6.14e-12 ***
#> x 0.062109 0.006091 10.2 5.18e-05 ***
#> ---
#> Signif. codes: 0 ‘***’ 0.001 ‘**’ 0.01 ‘*’ 0.05 ‘.’ 0.1 ‘ ’ 1
#>
#> Residual standard error: 0.03948 on 6 degrees of freedom
#> Multiple R-squared: 0.9454, Adjusted R-squared: 0.9363
#> F-statistic: 104 on 1 and 6 DF, p-value: 5.184e-05
#>
#>
#> $`D:0:2`
#>
#> Call:
#> lm(formula = y ~ x)
#>
#> Residuals:
#> 1 2 3 4 5
#> -0.02690 -0.06984 0.11315 0.09083 -0.10724
#>
#> Coefficients:
#> Estimate Std. Error t value Pr(>|t|)
#> (Intercept) -4.76605 0.18531 -25.719 0.000129 ***
#> x 0.27655 0.03566 7.754 0.004461 **
#> ---
#> Signif. codes: 0 ‘***’ 0.001 ‘**’ 0.01 ‘*’ 0.05 ‘.’ 0.1 ‘ ’ 1
#>
#> Residual standard error: 0.1128 on 3 degrees of freedom
#> Multiple R-squared: 0.9525, Adjusted R-squared: 0.9366
#> F-statistic: 60.13 on 1 and 3 DF, p-value: 0.004461
#>
#>
#> $`R:0:2`
#>
#> Call:
#> lm(formula = y ~ x)
#>
#> Residuals:
#> 1 2 3 4 5 6
#> 0.05500 -0.05217 -0.06972 0.02605 0.09073 -0.04989
#>
#> Coefficients:
#> Estimate Std. Error t value Pr(>|t|)
#> (Intercept) -4.56440 0.06905 -66.10 3.14e-07 ***
#> x 0.24070 0.01773 13.57 0.00017 ***
#> ---
#> Signif. codes: 0 ‘***’ 0.001 ‘**’ 0.01 ‘*’ 0.05 ‘.’ 0.1 ‘ ’ 1
#>
#> Residual standard error: 0.07417 on 4 degrees of freedom
#> Multiple R-squared: 0.9788, Adjusted R-squared: 0.9734
#> F-statistic: 184.3 on 1 and 4 DF, p-value: 0.0001705
#>
#>
#> $`T:0:2`
#>
#> Call:
#> lm(formula = y ~ x)
#>
#> Residuals:
#> 1 2 3 4 5
#> 0.03684 -0.03070 -0.03457 0.01388 0.01455
#>
#> Coefficients:
#> Estimate Std. Error t value Pr(>|t|)
#> (Intercept) -4.56724 0.03781 -120.78 1.25e-06 ***
#> x 0.26170 0.01140 22.95 0.000181 ***
#> ---
#> Signif. codes: 0 ‘***’ 0.001 ‘**’ 0.01 ‘*’ 0.05 ‘.’ 0.1 ‘ ’ 1
#>
#> Residual standard error: 0.03605 on 3 degrees of freedom
#> Multiple R-squared: 0.9943, Adjusted R-squared: 0.9925
#> F-statistic: 526.9 on 1 and 3 DF, p-value: 0.0001811
#>
#>
#> $`D:0.24:2`
#>
#> Call:
#> lm(formula = y ~ x)
#>
#> Residuals:
#> 1 2 3 4 5
#> 0.022436 -0.020254 -0.022358 0.015734 0.004442
#>
#> Coefficients:
#> Estimate Std. Error t value Pr(>|t|)
#> (Intercept) -4.468380 0.038893 -114.89 1.45e-06 ***
#> x 0.209744 0.007485 28.02 9.98e-05 ***
#> ---
#> Signif. codes: 0 ‘***’ 0.001 ‘**’ 0.01 ‘*’ 0.05 ‘.’ 0.1 ‘ ’ 1
#>
#> Residual standard error: 0.02367 on 3 degrees of freedom
#> Multiple R-squared: 0.9962, Adjusted R-squared: 0.9949
#> F-statistic: 785.2 on 1 and 3 DF, p-value: 9.977e-05
#>
#>
#> $`R:0.24:2`
#>
#> Call:
#> lm(formula = y ~ x)
#>
#> Residuals:
#> Min 1Q Median 3Q Max
#> -0.013773 -0.005455 0.001812 0.004471 0.012121
#>
#> Coefficients:
#> Estimate Std. Error t value Pr(>|t|)
#> (Intercept) -4.2082601 0.0076499 -550.11 < 2e-16 ***
#> x 0.0430988 0.0005655 76.21 2.47e-16 ***
#> ---
#> Signif. codes: 0 ‘***’ 0.001 ‘**’ 0.01 ‘*’ 0.05 ‘.’ 0.1 ‘ ’ 1
#>
#> Residual standard error: 0.007629 on 11 degrees of freedom
#> Multiple R-squared: 0.9981, Adjusted R-squared: 0.9979
#> F-statistic: 5809 on 1 and 11 DF, p-value: 2.469e-16
#>
#>
#> $`T:0.24:2`
#>
#> Call:
#> lm(formula = y ~ x)
#>
#> Residuals:
#> 1 2 3 4 5 6
#> 0.04376 -0.01805 -0.05928 -0.03032 0.09189 -0.02800
#>
#> Coefficients:
#> Estimate Std. Error t value Pr(>|t|)
#> (Intercept) -4.15735 0.05870 -70.83 2.38e-07 ***
#> x 0.20157 0.01507 13.37 0.000181 ***
#> ---
#> Signif. codes: 0 ‘***’ 0.001 ‘**’ 0.01 ‘*’ 0.05 ‘.’ 0.1 ‘ ’ 1
#>
#> Residual standard error: 0.06305 on 4 degrees of freedom
#> Multiple R-squared: 0.9781, Adjusted R-squared: 0.9727
#> F-statistic: 178.9 on 1 and 4 DF, p-value: 0.0001808
#>
#>
#> $`D:0.49:2`
#>
#> Call:
#> lm(formula = y ~ x)
#>
#> Residuals:
#> 1 2 3 4 5 6
#> 0.06723 -0.14354 -0.09301 0.24174 0.03357 -0.10598
#>
#> Coefficients:
#> Estimate Std. Error t value Pr(>|t|)
#> (Intercept) -5.17264 0.18603 -27.805 9.95e-06 ***
#> x 0.29778 0.03865 7.704 0.00153 **
#> ---
#> Signif. codes: 0 ‘***’ 0.001 ‘**’ 0.01 ‘*’ 0.05 ‘.’ 0.1 ‘ ’ 1
#>
#> Residual standard error: 0.1617 on 4 degrees of freedom
#> Multiple R-squared: 0.9369, Adjusted R-squared: 0.9211
#> F-statistic: 59.36 on 1 and 4 DF, p-value: 0.001527
#>
#>
#> $`R:0.49:2`
#>
#> Call:
#> lm(formula = y ~ x)
#>
#> Residuals:
#> Min 1Q Median 3Q Max
#> -0.022325 -0.008193 0.003092 0.008815 0.014001
#>
#> Coefficients:
#> Estimate Std. Error t value Pr(>|t|)
#> (Intercept) -4.651420 0.009603 -484.37 < 2e-16 ***
#> x 0.074900 0.001351 55.43 1.25e-11 ***
#> ---
#> Signif. codes: 0 ‘***’ 0.001 ‘**’ 0.01 ‘*’ 0.05 ‘.’ 0.1 ‘ ’ 1
#>
#> Residual standard error: 0.01227 on 8 degrees of freedom
#> Multiple R-squared: 0.9974, Adjusted R-squared: 0.9971
#> F-statistic: 3072 on 1 and 8 DF, p-value: 1.246e-11
#>
#>
#> $`T:0.49:2`
#>
#> Call:
#> lm(formula = y ~ x)
#>
#> Residuals:
#> 1 2 3 4 5
#> 0.043383 -0.033646 -0.053727 0.034863 0.009128
#>
#> Coefficients:
#> Estimate Std. Error t value Pr(>|t|)
#> (Intercept) -4.17220 0.05138 -81.20 4.12e-06 ***
#> x 0.21679 0.01549 13.99 0.00079 ***
#> ---
#> Signif. codes: 0 ‘***’ 0.001 ‘**’ 0.01 ‘*’ 0.05 ‘.’ 0.1 ‘ ’ 1
#>
#> Residual standard error: 0.04899 on 3 degrees of freedom
#> Multiple R-squared: 0.9849, Adjusted R-squared: 0.9799
#> F-statistic: 195.8 on 1 and 3 DF, p-value: 0.0007901
#>
#>
#> $`D:0.98:2`
#>
#> Call:
#> lm(formula = y ~ x)
#>
#> Residuals:
#> 1 2 3 4 5
#> 0.07164 -0.08815 -0.09670 0.17129 -0.05808
#>
#> Coefficients:
#> Estimate Std. Error t value Pr(>|t|)
#> (Intercept) -5.1223 0.1816 -28.206 9.78e-05 ***
#> x 0.3139 0.0428 7.334 0.00524 **
#> ---
#> Signif. codes: 0 ‘***’ 0.001 ‘**’ 0.01 ‘*’ 0.05 ‘.’ 0.1 ‘ ’ 1
#>
#> Residual standard error: 0.1354 on 3 degrees of freedom
#> Multiple R-squared: 0.9472, Adjusted R-squared: 0.9296
#> F-statistic: 53.79 on 1 and 3 DF, p-value: 0.005237
#>
#>
#> $`R:0.98:2`
#>
#> Call:
#> lm(formula = y ~ x)
#>
#> Residuals:
#> 1 2 3 4 5 6
#> 0.005913 0.001958 -0.006451 -0.018774 0.019504 -0.002150
#>
#> Coefficients:
#> Estimate Std. Error t value Pr(>|t|)
#> (Intercept) -4.785244 0.032994 -145.03 1.36e-08 ***
#> x 0.072948 0.003418 21.34 2.85e-05 ***
#> ---
#> Signif. codes: 0 ‘***’ 0.001 ‘**’ 0.01 ‘*’ 0.05 ‘.’ 0.1 ‘ ’ 1
#>
#> Residual standard error: 0.0143 on 4 degrees of freedom
#> Multiple R-squared: 0.9913, Adjusted R-squared: 0.9891
#> F-statistic: 455.4 on 1 and 4 DF, p-value: 2.851e-05
#>
#>
#> $`T:0.98:2`
#>
#> Call:
#> lm(formula = y ~ x)
#>
#> Residuals:
#> 1 2 3 4 5
#> 0.039113 -0.034204 -0.042982 0.032121 0.005951
#>
#> Coefficients:
#> Estimate Std. Error t value Pr(>|t|)
#> (Intercept) -4.75842 0.04537 -104.88 1.91e-06 ***
#> x 0.29646 0.01368 21.67 0.000215 ***
#> ---
#> Signif. codes: 0 ‘***’ 0.001 ‘**’ 0.01 ‘*’ 0.05 ‘.’ 0.1 ‘ ’ 1
#>
#> Residual standard error: 0.04326 on 3 degrees of freedom
#> Multiple R-squared: 0.9937, Adjusted R-squared: 0.9915
#> F-statistic: 469.6 on 1 and 3 DF, p-value: 0.000215
#>
#>
#> $`D:1.95:2`
#>
#> Call:
#> lm(formula = y ~ x)
#>
#> Residuals:
#> 1 2 3 4 5 6
#> 0.03662 -0.09391 -0.07322 0.19416 0.02388 -0.08753
#>
#> Coefficients:
#> Estimate Std. Error t value Pr(>|t|)
#> (Intercept) -5.02885 0.14261 -35.263 3.86e-06 ***
#> x 0.28469 0.02963 9.608 0.000656 ***
#> ---
#> Signif. codes: 0 ‘***’ 0.001 ‘**’ 0.01 ‘*’ 0.05 ‘.’ 0.1 ‘ ’ 1
#>
#> Residual standard error: 0.1239 on 4 degrees of freedom
#> Multiple R-squared: 0.9585, Adjusted R-squared: 0.9481
#> F-statistic: 92.32 on 1 and 4 DF, p-value: 0.0006559
#>
#>
#> $`R:1.95:2`
#>
#> Call:
#> lm(formula = y ~ x)
#>
#> Residuals:
#> 1 2 3 4 5
#> -0.002388 -0.011156 0.019007 0.005008 -0.010471
#>
#> Coefficients:
#> Estimate Std. Error t value Pr(>|t|)
#> (Intercept) -4.133639 0.037114 -111.38 1.6e-06 ***
#> x 0.053219 0.004568 11.65 0.00136 **
#> ---
#> Signif. codes: 0 ‘***’ 0.001 ‘**’ 0.01 ‘*’ 0.05 ‘.’ 0.1 ‘ ’ 1
#>
#> Residual standard error: 0.01445 on 3 degrees of freedom
#> Multiple R-squared: 0.9784, Adjusted R-squared: 0.9712
#> F-statistic: 135.7 on 1 and 3 DF, p-value: 0.001359
#>
#>
#> $`T:1.95:2`
#>
#> Call:
#> lm(formula = y ~ x)
#>
#> Residuals:
#> 1 2 3 4 5
#> 0.05249 -0.03618 -0.06307 0.02472 0.02204
#>
#> Coefficients:
#> Estimate Std. Error t value Pr(>|t|)
#> (Intercept) -4.44817 0.05789 -76.84 4.86e-06 ***
#> x 0.26051 0.01745 14.93 0.000653 ***
#> ---
#> Signif. codes: 0 ‘***’ 0.001 ‘**’ 0.01 ‘*’ 0.05 ‘.’ 0.1 ‘ ’ 1
#>
#> Residual standard error: 0.05519 on 3 degrees of freedom
#> Multiple R-squared: 0.9867, Adjusted R-squared: 0.9823
#> F-statistic: 222.8 on 1 and 3 DF, p-value: 0.0006526
#>
#>
#> $`D:3.91:2`
#>
#> Call:
#> lm(formula = y ~ x)
#>
#> Residuals:
#> 1 2 3 4 5
#> 0.036831 -0.033926 -0.040464 0.035382 0.002177
#>
#> Coefficients:
#> Estimate Std. Error t value Pr(>|t|)
#> (Intercept) -5.17053 0.05693 -90.82 2.94e-06 ***
#> x 0.31192 0.01342 23.25 0.000174 ***
#> ---
#> Signif. codes: 0 ‘***’ 0.001 ‘**’ 0.01 ‘*’ 0.05 ‘.’ 0.1 ‘ ’ 1
#>
#> Residual standard error: 0.04243 on 3 degrees of freedom
#> Multiple R-squared: 0.9945, Adjusted R-squared: 0.9926
#> F-statistic: 540.4 on 1 and 3 DF, p-value: 0.0001744
#>
#>
#> $`R:3.91:2`
#>
#> Call:
#> lm(formula = y ~ x)
#>
#> Residuals:
#> 1 2 3 4 5
#> -0.004041 0.002173 0.003932 0.001778 -0.003843
#>
#> Coefficients:
#> Estimate Std. Error t value Pr(>|t|)
#> (Intercept) -4.641333 0.010944 -424.1 2.89e-08 ***
#> x 0.062779 0.001347 46.6 2.18e-05 ***
#> ---
#> Signif. codes: 0 ‘***’ 0.001 ‘**’ 0.01 ‘*’ 0.05 ‘.’ 0.1 ‘ ’ 1
#>
#> Residual standard error: 0.00426 on 3 degrees of freedom
#> Multiple R-squared: 0.9986, Adjusted R-squared: 0.9982
#> F-statistic: 2172 on 1 and 3 DF, p-value: 2.175e-05
#>
#>
#> $`T:3.91:2`
#>
#> Call:
#> lm(formula = y ~ x)
#>
#> Residuals:
#> 1 2 3 4 5
#> 0.046844 -0.037156 -0.057482 0.039056 0.008737
#>
#> Coefficients:
#> Estimate Std. Error t value Pr(>|t|)
#> (Intercept) -4.59370 0.05576 -82.38 3.94e-06 ***
#> x 0.27816 0.01681 16.54 0.000481 ***
#> ---
#> Signif. codes: 0 ‘***’ 0.001 ‘**’ 0.01 ‘*’ 0.05 ‘.’ 0.1 ‘ ’ 1
#>
#> Residual standard error: 0.05317 on 3 degrees of freedom
#> Multiple R-squared: 0.9892, Adjusted R-squared: 0.9855
#> F-statistic: 273.7 on 1 and 3 DF, p-value: 0.0004807
#>
#>
#> $`D:7.81:2`
#>
#> Call:
#> lm(formula = y ~ x)
#>
#> Residuals:
#> 1 2 3 4 5
#> 0.05848 -0.08452 -0.07052 0.16070 -0.06413
#>
#> Coefficients:
#> Estimate Std. Error t value Pr(>|t|)
#> (Intercept) -4.57258 0.16518 -27.683 0.000103 ***
#> x 0.24836 0.03893 6.379 0.007799 **
#> ---
#> Signif. codes: 0 ‘***’ 0.001 ‘**’ 0.01 ‘*’ 0.05 ‘.’ 0.1 ‘ ’ 1
#>
#> Residual standard error: 0.1231 on 3 degrees of freedom
#> Multiple R-squared: 0.9313, Adjusted R-squared: 0.9085
#> F-statistic: 40.69 on 1 and 3 DF, p-value: 0.007799
#>
#>
#> $`R:7.81:2`
#>
#> Call:
#> lm(formula = y ~ x)
#>
#> Residuals:
#> 1 2 3 4 5
#> -0.006984 -0.017367 0.035309 0.009422 -0.020379
#>
#> Coefficients:
#> Estimate Std. Error t value Pr(>|t|)
#> (Intercept) -4.958416 0.067989 -72.93 5.68e-06 ***
#> x 0.090425 0.008369 10.80 0.0017 **
#> ---
#> Signif. codes: 0 ‘***’ 0.001 ‘**’ 0.01 ‘*’ 0.05 ‘.’ 0.1 ‘ ’ 1
#>
#> Residual standard error: 0.02646 on 3 degrees of freedom
#> Multiple R-squared: 0.9749, Adjusted R-squared: 0.9666
#> F-statistic: 116.7 on 1 and 3 DF, p-value: 0.001696
#>
#>
#> $`T:7.81:2`
#>
#> Call:
#> lm(formula = y ~ x)
#>
#> Residuals:
#> 1 2 3 4 5
#> 0.014918 -0.033567 0.000835 0.039361 -0.021547
#>
#> Coefficients:
#> Estimate Std. Error t value Pr(>|t|)
#> (Intercept) -3.78947 0.04492 -84.35 3.67e-06 ***
#> x 0.16627 0.01059 15.70 0.000561 ***
#> ---
#> Signif. codes: 0 ‘***’ 0.001 ‘**’ 0.01 ‘*’ 0.05 ‘.’ 0.1 ‘ ’ 1
#>
#> Residual standard error: 0.03348 on 3 degrees of freedom
#> Multiple R-squared: 0.988, Adjusted R-squared: 0.984
#> F-statistic: 246.6 on 1 and 3 DF, p-value: 0.0005614
#>
#>
#> $`D:15.63:2`
#>
#> Call:
#> lm(formula = y ~ x)
#>
#> Residuals:
#> 1 2 3 4 5 6
#> 0.03705 -0.06309 -0.12273 0.23324 -0.03119 -0.05328
#>
#> Coefficients:
#> Estimate Std. Error t value Pr(>|t|)
#> (Intercept) -5.34919 0.16132 -33.160 4.93e-06 ***
#> x 0.30080 0.03352 8.975 0.000853 ***
#> ---
#> Signif. codes: 0 ‘***’ 0.001 ‘**’ 0.01 ‘*’ 0.05 ‘.’ 0.1 ‘ ’ 1
#>
#> Residual standard error: 0.1402 on 4 degrees of freedom
#> Multiple R-squared: 0.9527, Adjusted R-squared: 0.9409
#> F-statistic: 80.55 on 1 and 4 DF, p-value: 0.0008529
#>
#>
#> $`R:15.63:2`
#>
#> Call:
#> lm(formula = y ~ x)
#>
#> Residuals:
#> Min 1Q Median 3Q Max
#> -0.013772 -0.006886 0.001340 0.005031 0.021072
#>
#> Coefficients:
#> Estimate Std. Error t value Pr(>|t|)
#> (Intercept) -4.502916 0.010813 -416.43 < 2e-16 ***
#> x 0.060466 0.001205 50.17 2.76e-11 ***
#> ---
#> Signif. codes: 0 ‘***’ 0.001 ‘**’ 0.01 ‘*’ 0.05 ‘.’ 0.1 ‘ ’ 1
#>
#> Residual standard error: 0.01095 on 8 degrees of freedom
#> Multiple R-squared: 0.9968, Adjusted R-squared: 0.9964
#> F-statistic: 2517 on 1 and 8 DF, p-value: 2.758e-11
#>
#>
#> $`T:15.63:2`
#>
#> Call:
#> lm(formula = y ~ x)
#>
#> Residuals:
#> 1 2 3 4 5 6
#> 0.029463 -0.015157 -0.044274 0.003571 0.038993 -0.012596
#>
#> Coefficients:
#> Estimate Std. Error t value Pr(>|t|)
#> (Intercept) -5.129049 0.047440 -108.12 4.39e-08 ***
#> x 0.252260 0.008237 30.62 6.77e-06 ***
#> ---
#> Signif. codes: 0 ‘***’ 0.001 ‘**’ 0.01 ‘*’ 0.05 ‘.’ 0.1 ‘ ’ 1
#>
#> Residual standard error: 0.03446 on 4 degrees of freedom
#> Multiple R-squared: 0.9958, Adjusted R-squared: 0.9947
#> F-statistic: 937.8 on 1 and 4 DF, p-value: 6.774e-06
#>
#>
#> $`D:31.25:2`
#>
#> Call:
#> lm(formula = y ~ x)
#>
#> Residuals:
#> 1 2 3 4 5 6
#> 0.025175 -0.017801 -0.020285 -0.012617 0.031419 -0.005891
#>
#> Coefficients:
#> Estimate Std. Error t value Pr(>|t|)
#> (Intercept) -5.748082 0.058179 -98.80 6.29e-08 ***
#> x 0.243646 0.006028 40.42 2.24e-06 ***
#> ---
#> Signif. codes: 0 ‘***’ 0.001 ‘**’ 0.01 ‘*’ 0.05 ‘.’ 0.1 ‘ ’ 1
#>
#> Residual standard error: 0.02521 on 4 degrees of freedom
#> Multiple R-squared: 0.9976, Adjusted R-squared: 0.9969
#> F-statistic: 1634 on 1 and 4 DF, p-value: 2.238e-06
#>
#>
#> $`R:31.25:2`
#>
#> Call:
#> lm(formula = y ~ x)
#>
#> Residuals:
#> 1 2 3 4 5
#> 0.004447 -0.017367 0.023877 -0.013442 0.002485
#>
#> Coefficients:
#> Estimate Std. Error t value Pr(>|t|)
#> (Intercept) -5.242152 0.060551 -86.58 3.4e-06 ***
#> x 0.101857 0.005995 16.99 0.000444 ***
#> ---
#> Signif. codes: 0 ‘***’ 0.001 ‘**’ 0.01 ‘*’ 0.05 ‘.’ 0.1 ‘ ’ 1
#>
#> Residual standard error: 0.01896 on 3 degrees of freedom
#> Multiple R-squared: 0.9897, Adjusted R-squared: 0.9863
#> F-statistic: 288.6 on 1 and 3 DF, p-value: 0.0004442
#>
#>
#> $`T:31.25:2`
#>
#> Call:
#> lm(formula = y ~ x)
#>
#> Residuals:
#> 1 2 3 4 5 6
#> 0.021058 -0.023826 -0.010519 -0.001336 0.024241 -0.009618
#>
#> Coefficients:
#> Estimate Std. Error t value Pr(>|t|)
#> (Intercept) -6.282227 0.074112 -84.77 1.16e-07 ***
#> x 0.191488 0.005076 37.72 2.95e-06 ***
#> ---
#> Signif. codes: 0 ‘***’ 0.001 ‘**’ 0.01 ‘*’ 0.05 ‘.’ 0.1 ‘ ’ 1
#>
#> Residual standard error: 0.02123 on 4 degrees of freedom
#> Multiple R-squared: 0.9972, Adjusted R-squared: 0.9965
#> F-statistic: 1423 on 1 and 4 DF, p-value: 2.949e-06
#>
#>
#> $`D:62.5:2`
#>
#> Call:
#> lm(formula = y ~ x)
#>
#> Residuals:
#> 1 2 3 4 5 6
#> 0.010586 -0.015019 -0.005737 0.005026 0.014308 -0.009163
#>
#> Coefficients:
#> Estimate Std. Error t value Pr(>|t|)
#> (Intercept) -6.039366 0.070560 -85.59 1.12e-07 ***
#> x 0.133819 0.003127 42.79 1.78e-06 ***
#> ---
#> Signif. codes: 0 ‘***’ 0.001 ‘**’ 0.01 ‘*’ 0.05 ‘.’ 0.1 ‘ ’ 1
#>
#> Residual standard error: 0.01308 on 4 degrees of freedom
#> Multiple R-squared: 0.9978, Adjusted R-squared: 0.9973
#> F-statistic: 1831 on 1 and 4 DF, p-value: 1.782e-06
#>
#>
#> $`R:62.5:2`
#>
#> Call:
#> lm(formula = y ~ x)
#>
#> Residuals:
#> 1 2 3 4 5
#> -0.005311 0.002885 0.005147 0.002293 -0.005015
#>
#> Coefficients:
#> Estimate Std. Error t value Pr(>|t|)
#> (Intercept) -4.561231 0.007487 -609.21 9.75e-09 ***
#> x 0.071846 0.001765 40.71 3.26e-05 ***
#> ---
#> Signif. codes: 0 ‘***’ 0.001 ‘**’ 0.01 ‘*’ 0.05 ‘.’ 0.1 ‘ ’ 1
#>
#> Residual standard error: 0.005581 on 3 degrees of freedom
#> Multiple R-squared: 0.9982, Adjusted R-squared: 0.9976
#> F-statistic: 1658 on 1 and 3 DF, p-value: 3.261e-05
#>
#>
#> $`T:62.5:2`
#>
#> Call:
#> lm(formula = y ~ x)
#>
#> Residuals:
#> 1 2 3 4 5
#> -0.007294 0.004016 0.007028 0.003071 -0.006821
#>
#> Coefficients:
#> Estimate Std. Error t value Pr(>|t|)
#> (Intercept) -4.597876 0.005911 -777.89 4.69e-09 ***
#> x 0.084000 0.002413 34.81 5.21e-05 ***
#> ---
#> Signif. codes: 0 ‘***’ 0.001 ‘**’ 0.01 ‘*’ 0.05 ‘.’ 0.1 ‘ ’ 1
#>
#> Residual standard error: 0.007631 on 3 degrees of freedom
#> Multiple R-squared: 0.9975, Adjusted R-squared: 0.9967
#> F-statistic: 1212 on 1 and 3 DF, p-value: 5.212e-05
#>
#>
#> $`D:125:2`
#>
#> Call:
#> lm(formula = y ~ x)
#>
#> Residuals:
#> 1 2 3 4 5
#> -0.006984 -0.017367 0.035309 0.009422 -0.020379
#>
#> Coefficients:
#> Estimate Std. Error t value Pr(>|t|)
#> (Intercept) -4.958416 0.067989 -72.93 5.68e-06 ***
#> x 0.090425 0.008369 10.80 0.0017 **
#> ---
#> Signif. codes: 0 ‘***’ 0.001 ‘**’ 0.01 ‘*’ 0.05 ‘.’ 0.1 ‘ ’ 1
#>
#> Residual standard error: 0.02646 on 3 degrees of freedom
#> Multiple R-squared: 0.9749, Adjusted R-squared: 0.9666
#> F-statistic: 116.7 on 1 and 3 DF, p-value: 0.001696
#>
#>
#> $`R:125:2`
#>
#> Call:
#> lm(formula = y ~ x)
#>
#> Residuals:
#> 1 2 3 4 5 6
#> 0.022411 -0.040044 -0.007189 0.017367 0.034955 -0.027500
#>
#> Coefficients:
#> Estimate Std. Error t value Pr(>|t|)
#> (Intercept) -4.752491 0.038321 -124.018 2.54e-08 ***
#> x 0.062455 0.007962 7.844 0.00143 **
#> ---
#> Signif. codes: 0 ‘***’ 0.001 ‘**’ 0.01 ‘*’ 0.05 ‘.’ 0.1 ‘ ’ 1
#>
#> Residual standard error: 0.03331 on 4 degrees of freedom
#> Multiple R-squared: 0.939, Adjusted R-squared: 0.9237
#> F-statistic: 61.54 on 1 and 4 DF, p-value: 0.001426
#>
#>
#> $`T:125:2`
#>
#> Call:
#> lm(formula = y ~ x)
#>
#> Residuals:
#> 1 2 3 4 5
#> -0.019983 0.003381 0.019776 0.030237 -0.033411
#>
#> Coefficients:
#> Estimate Std. Error t value Pr(>|t|)
#> (Intercept) -4.489877 0.023801 -188.64 3.28e-07 ***
#> x 0.063647 0.009717 6.55 0.00723 **
#> ---
#> Signif. codes: 0 ‘***’ 0.001 ‘**’ 0.01 ‘*’ 0.05 ‘.’ 0.1 ‘ ’ 1
#>
#> Residual standard error: 0.03073 on 3 degrees of freedom
#> Multiple R-squared: 0.9347, Adjusted R-squared: 0.9129
#> F-statistic: 42.91 on 1 and 3 DF, p-value: 0.007234
#>
#>
#> $`D:250:2`
#>
#> Call:
#> lm(formula = y ~ x)
#>
#> Residuals:
#> 1 2 3 4 5
#> 0.006580 0.001696 -0.006655 -0.018097 0.016477
#>
#> Coefficients:
#> Estimate Std. Error t value Pr(>|t|)
#> (Intercept) -4.207256 0.015900 -264.61 1.19e-07 ***
#> x 0.065509 0.004794 13.66 0.000848 ***
#> ---
#> Signif. codes: 0 ‘***’ 0.001 ‘**’ 0.01 ‘*’ 0.05 ‘.’ 0.1 ‘ ’ 1
#>
#> Residual standard error: 0.01516 on 3 degrees of freedom
#> Multiple R-squared: 0.9842, Adjusted R-squared: 0.9789
#> F-statistic: 186.7 on 1 and 3 DF, p-value: 0.0008479
#>
#>
#> $`R:250:2`
#>
#> Call:
#> lm(formula = y ~ x)
#>
#> Residuals:
#> 1 2 3 4 5
#> -0.02283 0.04831 -0.03471 0.01581 -0.00658
#>
#> Coefficients:
#> Estimate Std. Error t value Pr(>|t|)
#> (Intercept) -4.56605 0.05110 -89.349 3.09e-06 ***
#> x 0.08301 0.01205 6.892 0.00626 **
#> ---
#> Signif. codes: 0 ‘***’ 0.001 ‘**’ 0.01 ‘*’ 0.05 ‘.’ 0.1 ‘ ’ 1
#>
#> Residual standard error: 0.03809 on 3 degrees of freedom
#> Multiple R-squared: 0.9406, Adjusted R-squared: 0.9208
#> F-statistic: 47.5 on 1 and 3 DF, p-value: 0.006259
#>
#>
#> $`T:250:2`
#>
#> Call:
#> lm(formula = y ~ x)
#>
#> Residuals:
#> 1 2 3 4 5 6
#> 0.03506 -0.06422 -0.02039 0.06265 0.01744 -0.03054
#>
#> Coefficients:
#> Estimate Std. Error t value Pr(>|t|)
#> (Intercept) -4.37787 0.03783 -115.711 3.35e-08 ***
#> x 0.09928 0.01250 7.944 0.00136 **
#> ---
#> Signif. codes: 0 ‘***’ 0.001 ‘**’ 0.01 ‘*’ 0.05 ‘.’ 0.1 ‘ ’ 1
#>
#> Residual standard error: 0.05228 on 4 degrees of freedom
#> Multiple R-squared: 0.9404, Adjusted R-squared: 0.9255
#> F-statistic: 63.12 on 1 and 4 DF, p-value: 0.001359
#>
#>
coef(L)
#> y0 y0_lm mumax lag
#> D:0:1 0.018 0.012348195 0.20489854 1.83926074
#> R:0:1 0.011 0.008831178 0.25630432 0.85682072
#> T:0:1 0.009 0.005900763 0.31191925 1.35337257
#> D:0.24:1 0.023 0.014709250 0.18989888 2.35397718
#> R:0.24:1 0.017 0.014078785 0.05322855 3.54216424
#> T:0.24:1 0.016 0.011774984 0.21204548 1.44597029
#> D:0.49:1 0.031 0.025240660 0.13509722 1.52135628
#> R:0.49:1 0.009 0.007089855 0.13450009 1.77367653
#> T:0.49:1 0.011 0.007238015 0.29111544 1.43773978
#> D:0.98:1 0.010 0.006142502 0.31756203 1.53467001
#> R:0.98:1 0.009 0.007133502 0.09504288 2.44544713
#> T:0.98:1 0.008 0.006207722 0.30095478 0.84280940
#> D:1.95:1 0.010 0.005948446 0.33108133 1.56896521
#> R:1.95:1 0.009 0.006657909 0.09507972 3.17017248
#> T:1.95:1 0.009 0.006966166 0.28703658 0.89242838
#> D:3.91:1 0.010 0.006736215 0.30800048 1.28274758
#> R:3.91:1 0.010 0.007629770 0.08148875 3.31981323
#> T:3.91:1 0.009 0.007146418 0.27983373 0.82410818
#> D:7.81:1 0.012 0.008072406 0.28794897 1.37682390
#> R:7.81:1 0.009 0.007418187 0.09002548 2.14705786
#> T:7.81:1 0.009 0.005693913 0.31098355 1.47218990
#> D:15.63:1 0.012 0.008069409 0.25639239 1.54773087
#> R:15.63:1 0.010 0.006274882 0.10546795 4.41869234
#> T:15.63:1 0.009 0.004445029 0.24355111 2.89646916
#> D:31.25:1 0.014 0.003994867 0.23813934 5.26602198
#> R:31.25:1 0.010 0.006989825 0.11820348 3.02977233
#> T:31.25:1 0.010 0.001271757 0.24751212 8.33165669
#> D:62.5:1 0.011 0.004412020 0.11415189 8.00304535
#> R:62.5:1 0.009 0.007349083 0.10782755 1.87938124
#> T:62.5:1 0.009 0.008923245 0.07967661 0.10749618
#> D:125:1 0.010 0.009261622 0.08399986 0.91316728
#> R:125:1 0.009 0.008202567 0.06847905 1.35482968
#> T:125:1 0.008 0.008056028 0.08375782 -0.08332446
#> D:250:1 0.013 0.012453101 0.06500113 0.66121499
#> R:250:1 0.012 0.012231518 0.07184650 -0.26597509
#> T:250:1 0.011 0.010193109 0.06210864 1.22661516
#> D:0:2 0.014 0.008513917 0.27654723 1.79844598
#> R:0:2 0.013 0.010416112 0.24070074 0.92062666
#> T:0:2 0.013 0.010386601 0.26169927 0.85759785
#> D:0.24:2 0.020 0.011465880 0.20974366 2.65255497
#> R:0.24:2 0.017 0.014872222 0.04309883 3.10259405
#> T:0.24:2 0.019 0.015648960 0.20157002 0.96261599
#> D:0.49:2 0.009 0.005669556 0.29777802 1.55187340
#> R:0.49:2 0.011 0.009548033 0.07490036 1.88997935
#> T:0.49:2 0.019 0.015418355 0.21679102 0.96351005
#> D:0.98:2 0.010 0.005962000 0.31393257 1.64742097
#> R:0.98:2 0.010 0.008352086 0.07294759 2.46853567
#> T:0.98:2 0.011 0.008579133 0.29646046 0.83843370
#> D:1.95:2 0.011 0.006546358 0.28468758 1.82300320
#> R:1.95:2 0.018 0.016024459 0.05321911 2.18446881
#> T:1.95:2 0.015 0.011700006 0.26051234 0.95373938
#> D:3.91:2 0.009 0.005681560 0.31191925 1.47473670
#> R:3.91:2 0.012 0.009644836 0.06277920 3.48019692
#> T:3.91:2 0.013 0.010115396 0.27815520 0.90198114
#> D:7.81:2 0.016 0.010331283 0.24835941 1.76120684
#> R:7.81:2 0.010 0.007024046 0.09042528 3.90649229
#> T:7.81:2 0.028 0.022607499 0.16626824 1.28661289
#> D:15.63:2 0.008 0.004752007 0.30080497 1.73160202
#> R:15.63:2 0.013 0.011076649 0.06046648 2.64791550
#> T:15.63:2 0.011 0.005922191 0.25225990 2.45456677
#> D:31.25:2 0.012 0.003188892 0.24364624 5.43916975
#> R:31.25:2 0.010 0.005288865 0.10185696 6.25368505
#> T:31.25:2 0.011 0.001869233 0.19148771 9.25577533
#> D:62.5:2 0.008 0.002383069 0.13381865 9.04995173
#> R:62.5:2 0.011 0.010449190 0.07184650 0.71500793
#> T:62.5:2 0.010 0.010073206 0.08399986 -0.08683272
#> D:125:2 0.009 0.007024046 0.09042528 2.74132563
#> R:125:2 0.009 0.008630170 0.06245501 0.67184897
#> T:125:2 0.011 0.011222023 0.06364748 -0.31396304
#> D:250:2 0.015 0.014887160 0.06550931 0.11526718
#> R:250:2 0.012 0.010398970 0.08301448 1.72499895
#> T:250:2 0.013 0.012552110 0.09927729 0.35315817
rsquared(L)
#> D:0:1.r2 R:0:1.r2 T:0:1.r2 D:0.24:1.r2 R:0.24:1.r2 T:0.24:1.r2
#> 0.9832876 0.9824181 0.9934273 0.9920096 0.9897308 0.9795705
#> D:0.49:1.r2 R:0.49:1.r2 T:0.49:1.r2 D:0.98:1.r2 R:0.98:1.r2 T:0.98:1.r2
#> 0.9418965 0.9992118 0.9933967 0.9758880 0.9842060 0.9837687
#> D:1.95:1.r2 R:1.95:1.r2 T:1.95:1.r2 D:3.91:1.r2 R:3.91:1.r2 T:3.91:1.r2
#> 0.9593622 0.9971530 0.9779951 0.9784173 0.9938112 0.9910183
#> D:7.81:1.r2 R:7.81:1.r2 T:7.81:1.r2 D:15.63:1.r2 R:15.63:1.r2 T:15.63:1.r2
#> 0.9640095 0.9972508 0.9669188 0.9576123 0.9953037 0.9608546
#> D:31.25:1.r2 R:31.25:1.r2 T:31.25:1.r2 D:62.5:1.r2 R:62.5:1.r2 T:62.5:1.r2
#> 0.9948442 0.9940203 0.9981896 0.9973064 0.9758310 0.9033606
#> D:125:1.r2 R:125:1.r2 T:125:1.r2 D:250:1.r2 R:250:1.r2 T:250:1.r2
#> 0.9975305 0.9387857 0.8956263 0.9665499 0.9179874 0.9454368
#> D:0:2.r2 R:0:2.r2 T:0:2.r2 D:0.24:2.r2 R:0.24:2.r2 T:0.24:2.r2
#> 0.9524807 0.9787556 0.9943384 0.9961940 0.9981098 0.9781243
#> D:0.49:2.r2 R:0.49:2.r2 T:0.49:2.r2 D:0.98:2.r2 R:0.98:2.r2 T:0.98:2.r2
#> 0.9368668 0.9974027 0.9849125 0.9471733 0.9912935 0.9936525
#> D:1.95:2.r2 R:1.95:2.r2 T:1.95:2.r2 D:3.91:2.r2 R:3.91:2.r2 T:3.91:2.r2
#> 0.9584714 0.9783713 0.9867135 0.9944789 0.9986206 0.9891576
#> D:7.81:2.r2 R:7.81:2.r2 T:7.81:2.r2 D:15.63:2.r2 R:15.63:2.r2 T:15.63:2.r2
#> 0.9313411 0.9749470 0.9879793 0.9526920 0.9968320 0.9957528
#> D:31.25:2.r2 R:31.25:2.r2 T:31.25:2.r2 D:62.5:2.r2 R:62.5:2.r2 T:62.5:2.r2
#> 0.9975580 0.9897131 0.9971970 0.9978206 0.9981933 0.9975305
#> D:125:2.r2 R:125:2.r2 T:125:2.r2 D:250:2.r2 R:250:2.r2 T:250:2.r2
#> 0.9749470 0.9389642 0.9346510 0.9841880 0.9405925 0.9404008
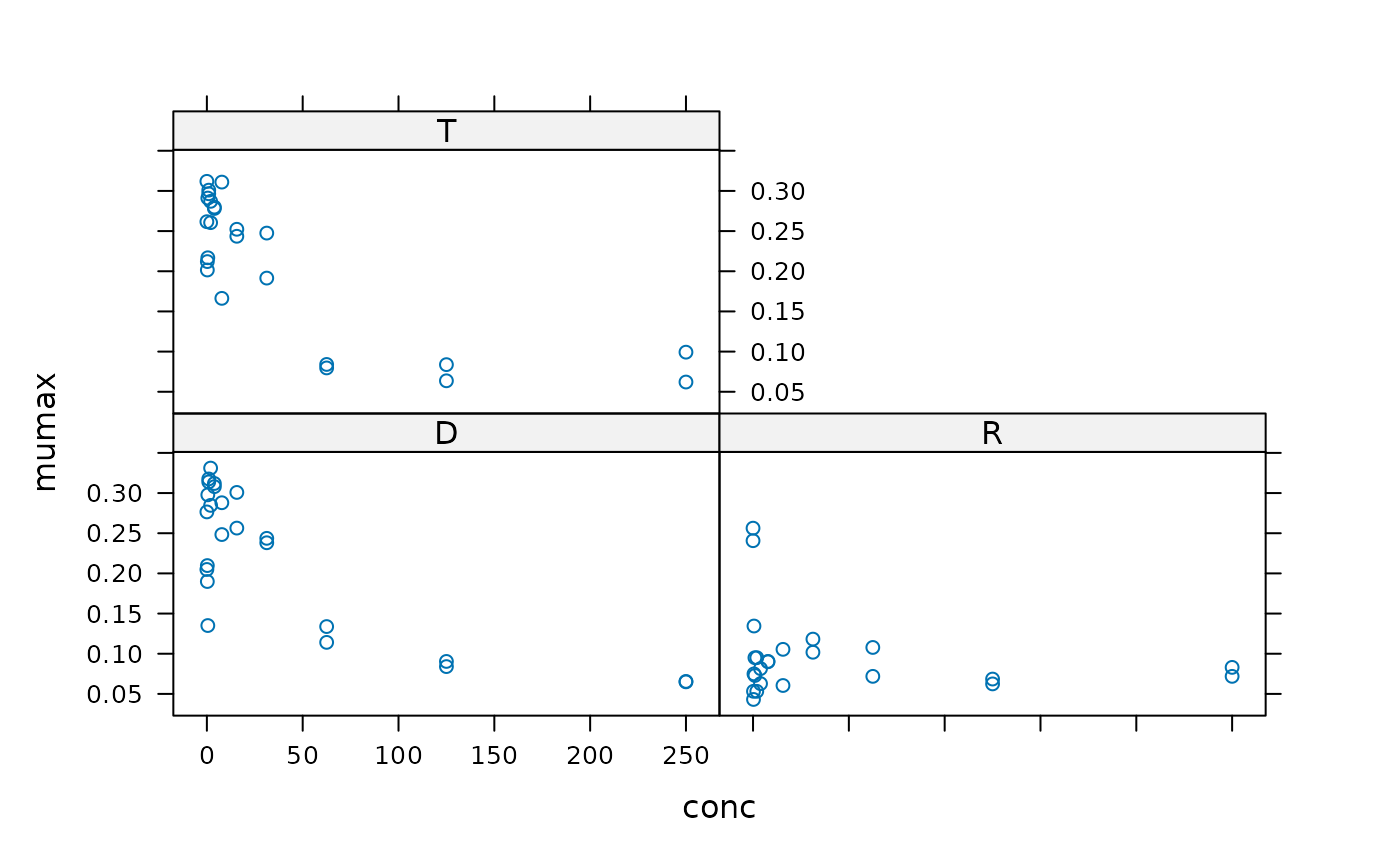
results <- results(L)
library(lattice)
xyplot(mumax ~ conc|strain, data=results)
 # }
# }