Identify Peaks in Multimodal Density Curves and Time Series
peakwindow.RdThis function identifies peaks in multimodal empirical density functions or in time series and helps to identify the time window of the first maximum according to a given heuristics.
peakwindow(
  x,
  y = NULL,
  xstart = 0,
  xend = max(x),
  minpeak = 0.1,
  mincut = 0.382
)
Arguments
| x | x coordinate of a set of points. |
|---|---|
| y | y coordinate of a set of points. Alternatively, a single argument x can be provided. |
| xstart | start before the maximum value of the searched peak (this is a ``weak'' limit) |
| xend | maximum of the end of the searched peak (this is a ``hard'' maximum) |
| minpeak | minimum value of the total maximum which is regarded as peak |
| mincut | minimum relative height of a pit compared to the lower of the two neighbouring maxima at which these maxima are regarded as separate peaks (default value is derived from golden section) |
Value
A list with the following elements:
a data frame with the characteristics (index, xleft, x, xright and y) of all identified peaks,
index of the maximum value of the ``specified'' peak,
x-value of the maximum of the ``specified'' peak,
indices (data window) of all data belonging to the ``specified'' peak,
x-values (time window) of all data belonging to the ``specified'' peak,
corresponding y-values of all data belonging to the ``specified'' peak,
vector with peak-id-numbers for all data.
Examples
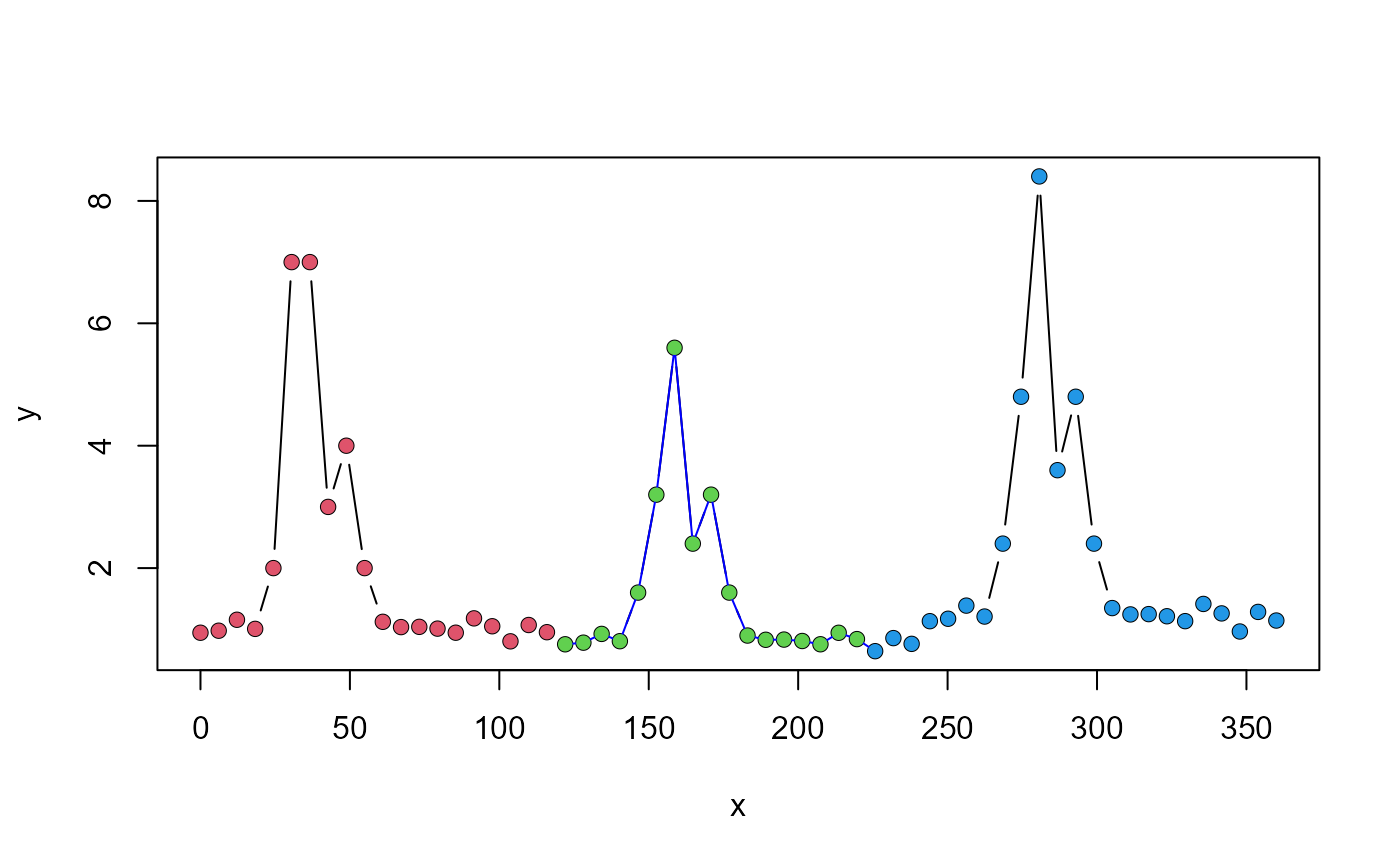
## generate test data with 3 peaks set.seed(123) x <- seq(0, 360, length = 20) y <- abs(rnorm(20, mean = 1, sd = 0.1)) y[5:10] <- c(2, 4, 7, 3, 4, 2) y <- c(y, 0.8 * y, 1.2 * y) x <- seq(0, 360, along = y) y[6] <- y[7] # test case with 2 neighbouring equal points ## plot the test data plot(x, y, type="b")## identify the first peak peaks <- peakwindow(x, y) ind <- peaks$smd.indices lines(x[ind], y[ind], col="red", lwd=2)## some more options ... peaks <- peakwindow(x, y, xstart=150, mincut = 0.455) ind <- peaks$first.indices lines(x[ind], y[ind], col = "blue")## work with indices only peaks <- peakwindow(y) ## test case with disturbed sinus x<- 1:100 y <- sin(x/5) +1.5 + rnorm(x, sd = 0.2) peaks <- peakwindow(x, y) plot(x, y, type = "l", ylim = c(0, 3))#> $peaks #> index xleft x xright y #> 1 11 1 11 21 11 #> #> $first.max.index #> [1] 11 #> #> $first.max.x #> [1] 11 #> #> $first.indices #> [1] 1 2 3 4 5 6 7 8 9 10 11 12 13 14 15 16 17 18 19 20 21 #> #> $first.x #> [1] 1 2 3 4 5 6 7 8 9 10 11 12 13 14 15 16 17 18 19 20 21 #> #> $first.y #> [1] 1 2 3 4 5 6 7 8 9 10 11 10 9 8 7 6 5 4 3 2 1 #> #> $peakid #> [1] 1 1 1 1 1 1 1 1 1 1 1 1 1 1 1 1 1 1 1 1 1 #> #> attr(,"class") #> [1] "list" "abrPeakwindow"## error handling test case: no turnpoints # yy <- rep(1, length(x)) # peakwindow(x, yy)