Playful Teaching of Simulation Models

From Monolithic Shiny Apps to Quarto Dashboards and webR

Thomas Petzoldt and Johannes Feldbauer

2026-07-09

Playful Teaching
of Simulation Models:
From Monolithic Shiny Apps to Quarto Dashboards and webR

Thomas Petzoldt and
Johannes Feldbauer

The Teaching Challenge

Increasing Complexity \(\longrightarrow\) Cross-Disciplinary Skills


Demand in Research and Engineering

  • people who can use computers
  • people who can understand models
  • people who are able to develop models

School Experience

  • mathematics is complicated
  • programming is something for nerds
  • differential calculus is rocket science

Domain knowledge

  • Aquatic ecology, in my case 😉

Use of Web-based Apps with Shiny


Applications

  • Understanding of statistical concepts
  • Analysis of experimental data
  • Exploration of dynamic systems: growth, predator-prey, chaos
  • Complex ecological models: Cyanobacteria in lakes

Advantages

  • Interactivity: Playful exploration of data and models
  • Data: Direct access to test cases and real world data
  • Algorithms: full R ecosystem available

→ No installation hurdles, no Excel debugging


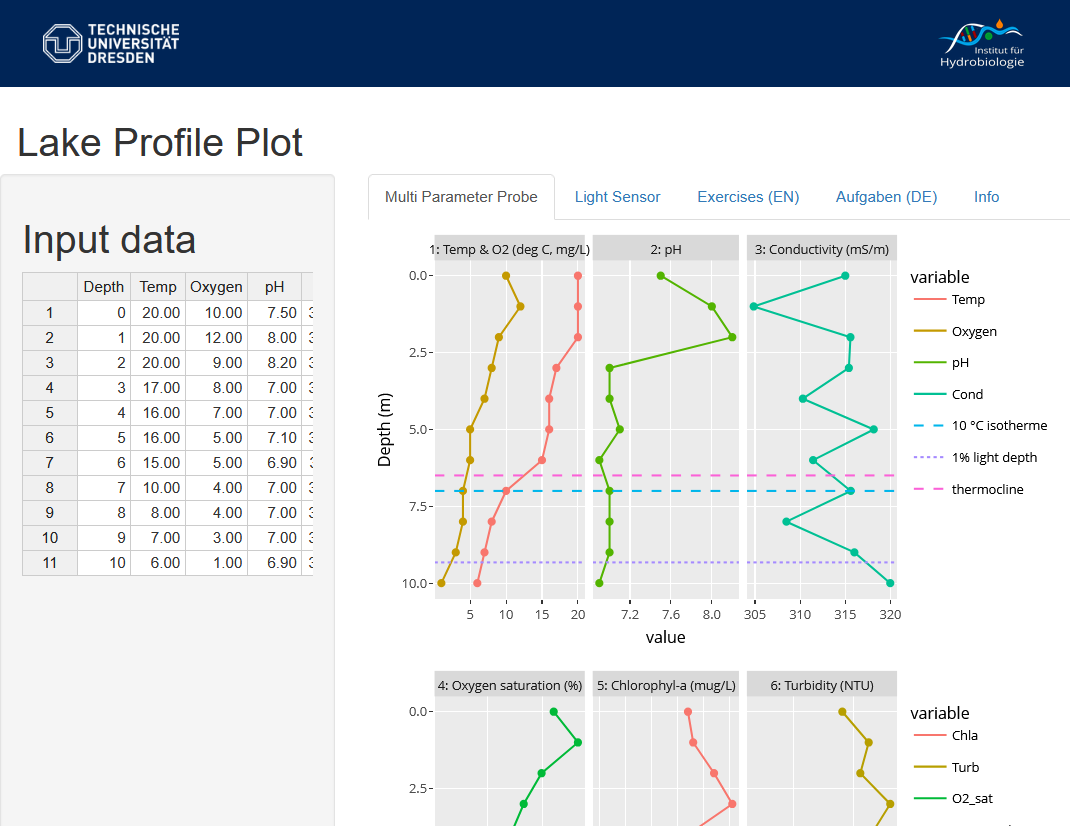
Example 1: Lake Profile Plotter


  • Analysis of multiparameter probe data
  • Limited time, avoid technical distractiona
  • Concentrate on scientific background and data interpretation
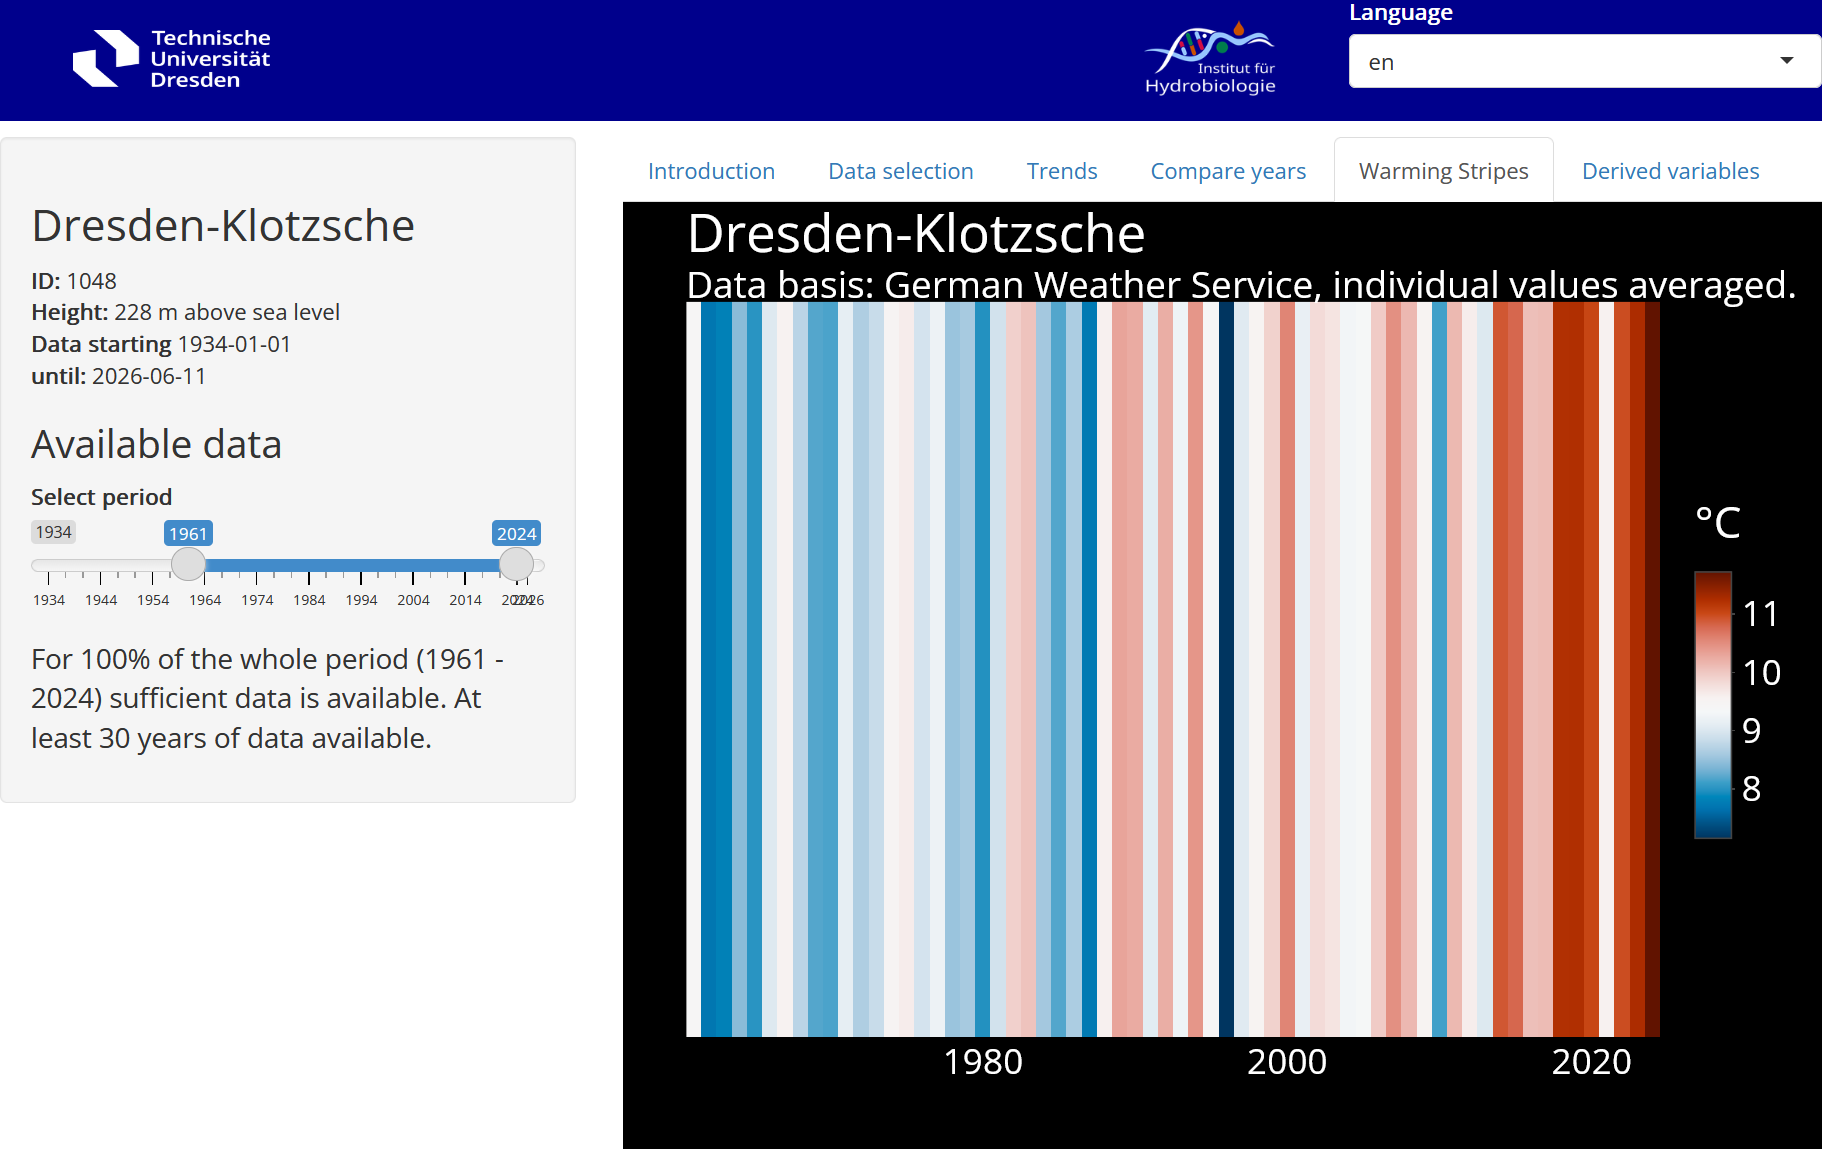
Example 2: Climate Data Explorer


  • Visualisation of climate data and trends
  • Data retrieval from the German Weather Service
  • Used in teaching and for public outreach

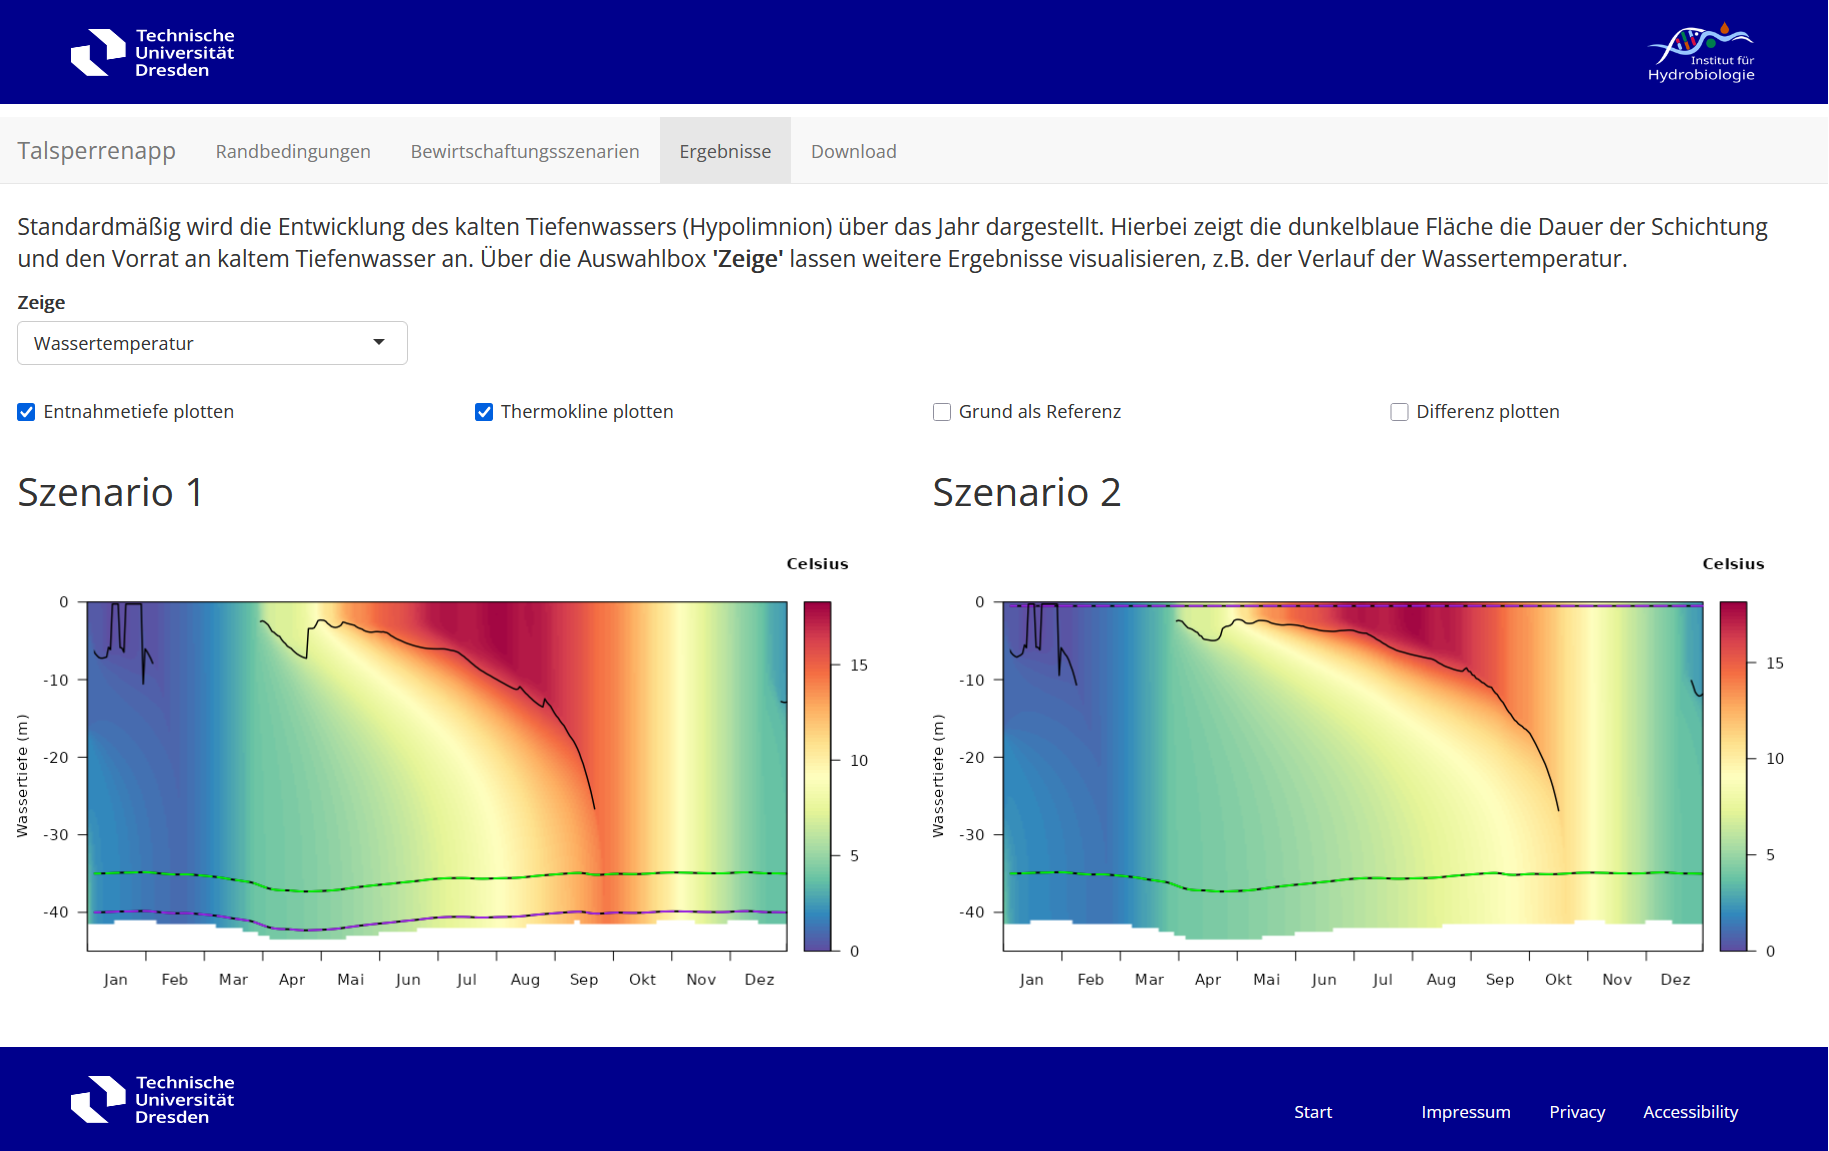
Example 3: Reservoir Management Model


Influence of Climate Warming on Water Availability from Drinking Water Reservoirs

  • Hydrophysical model GOTM provided as web service
  • Predefined scenarios
  • Quick performance
  • Results can be downloaded

Are we happy with this?

No

“Classical” Shiny Apps


Technical Fragmentation: Zoo of Apps

  • Server load, security, and OS updates
  • Regular updates and maintenance required
  • Each app has unique dependencies and design philosophy


Didactical: Media Fragmentation

  • Small apps: Limited complexity, self-explanatory but shallow
  • Complex apps:
    • High development effort,
    • Require additional explanations (e.g., handouts)
  • Storyboards: Linear, more focused on presentation than active learning

Approach

Step 1: Seamless Integration of Code and Docs


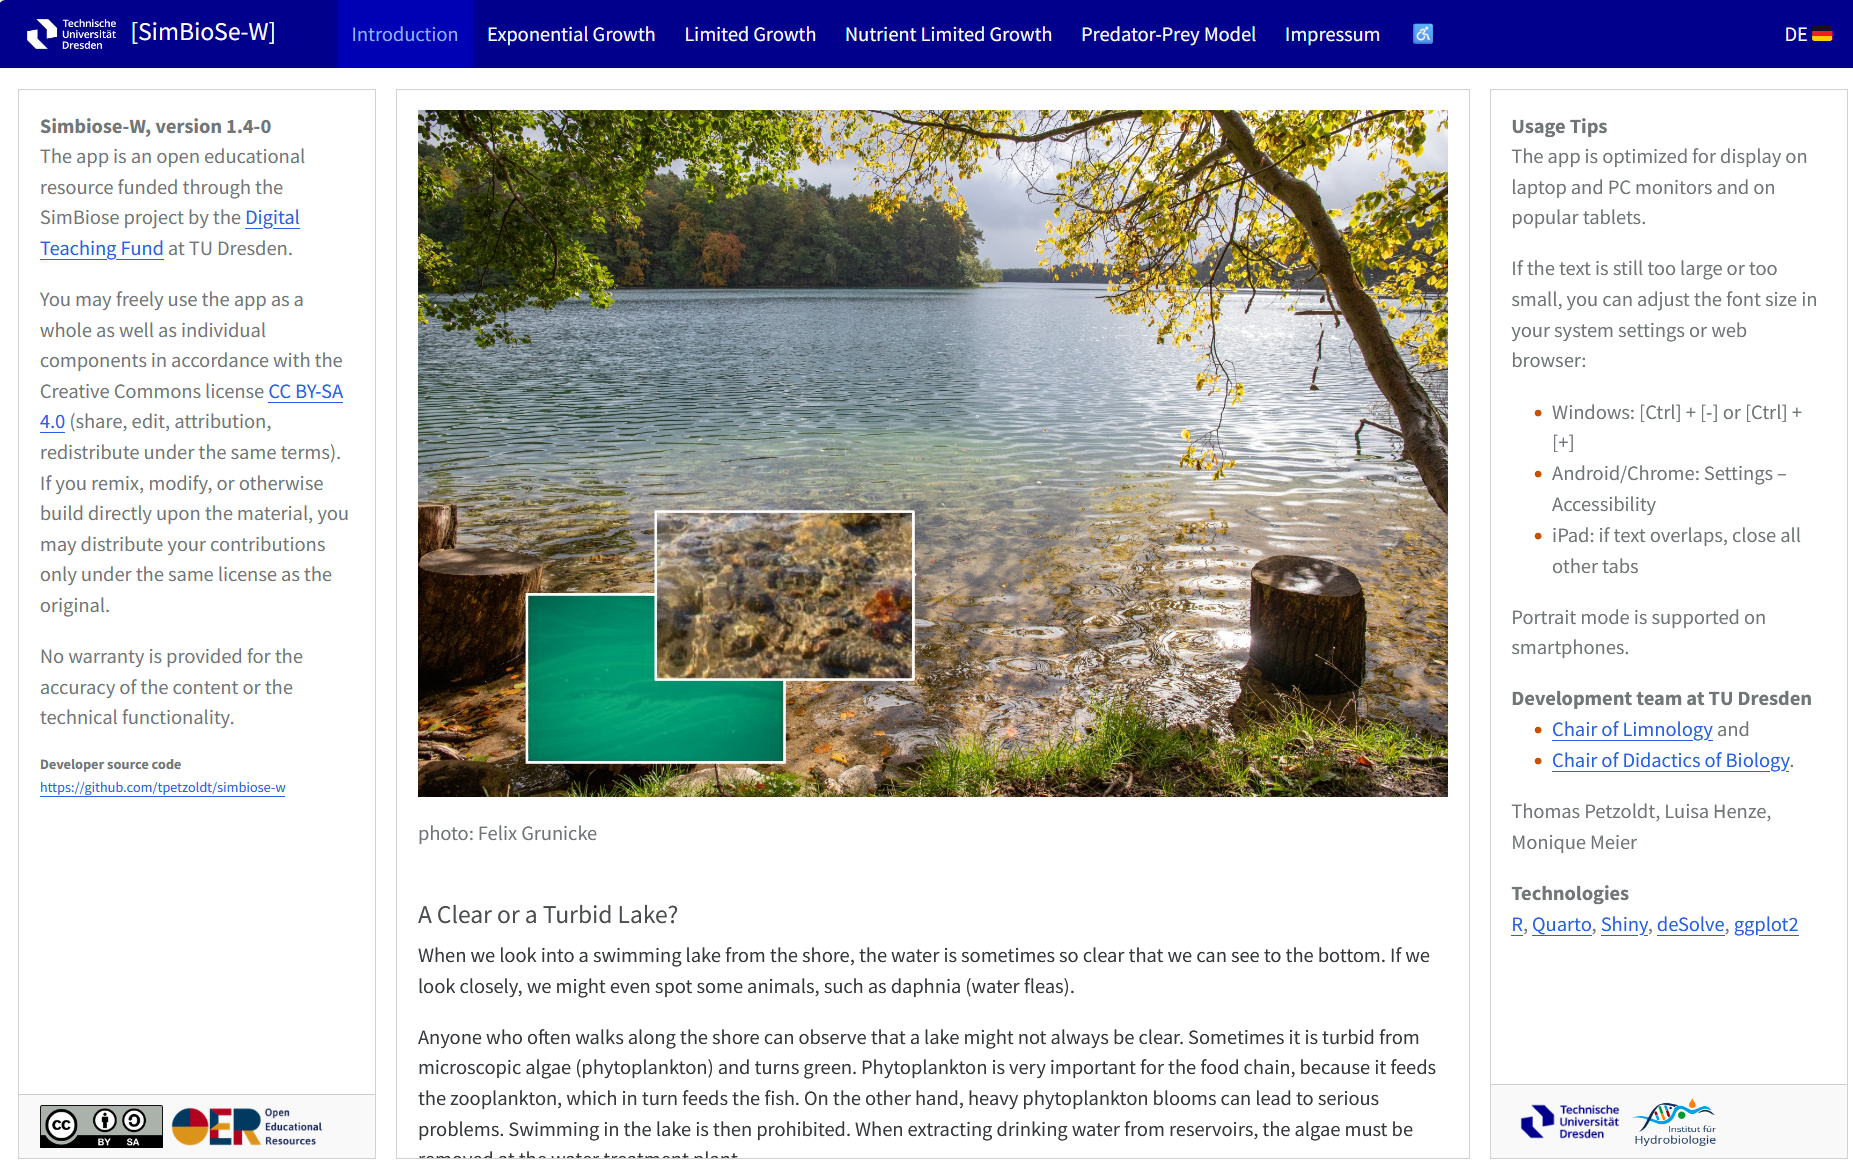
App to teach essential growth models

  • By example of a food-web in a lake
  • Eextensive textual information included

Target groups

  • Aquatic ecology students
  • Highschool students (11th year)
  • Future biology teachers

Implementation

  • Document-centric approach in form of a Quarto dashboard.
Quarto Structure Example


Outline with repeated elements

  • Caption hierarchy defines dashboard structure
  • Top Menu
  • Cards and Tabs

Modular and extensible

  • Separate code and text files
  • Independent testing and debugging
  • Easy translation
  • Adaptible for different audiences
# Exponential Growth

## Description

::: {.panel-tabset width="38%"}

### Example

{{< include exponential_example.qmd >}}

### The Model

{{< include exponential_description.qmd >}}

### Tasks

{{< include exponential_tasks.qmd >}}

### Hints

{{< include exponential_hints.qmd >}}

### Read More

{{< include exponential_more.qmd >}}

::: <!-- end tab set --->

<!-- contains code for 2 columns: widgets + graphics --->
{{< include ../code/exponential_code.qmd >}}

# Limited Growth

## Description

...

# Nutrient Limited Growth

...

# Predator-Prey Model

...

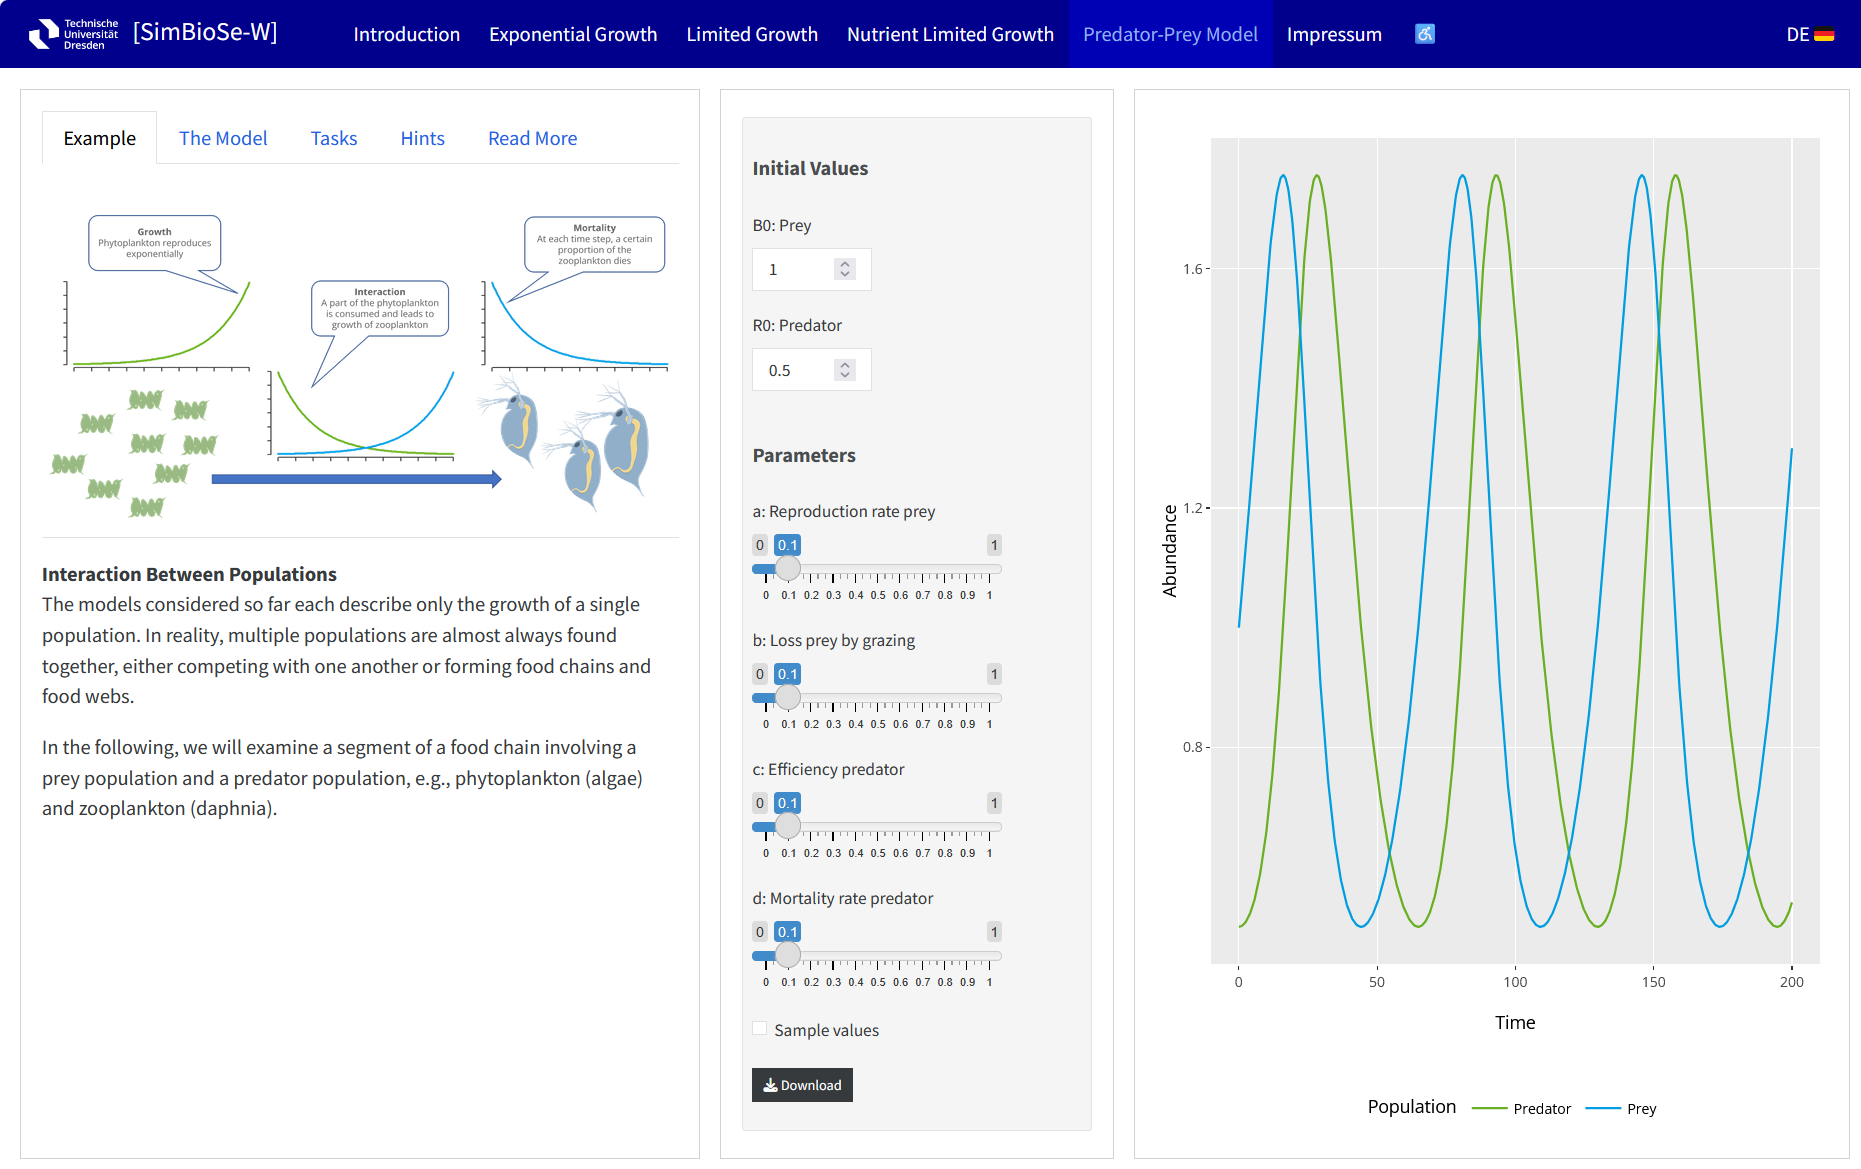
Example: Predator-Prey Model


Unified UI

  • Top-hierarchy as Quarto document
  • → Minimalistic to reduce user confusion

Integrated Design

  • Narrative + interaction + graphics
  • → Suitable for self-directed learning

Modular Structure

  • Separate files allow easier updates
  • Scalable and maintainable

Demo


Each section has a Description, organized as Panel Tabset:

  • Example: Introduction and real-world scenario
  • The Model: Explanation of processes and equations
  • Tasks: Exercises to explore model dynamics
  • Hints: Guidance for solving tasks
  • Read More: Links to resources or references

The Widgets and Graphics card integrates Shiny code to create interactive controls and visualization in a two-column layout.

Step 2: “Serverless” Deployment

WebR – R in the Browser


Avoids Specialized Shiny Server


  • Convert Shiny app with shinylive1 into standalone WebR2-Apps
  • Uses WebAssembly3 to run R and the app entirely in the browser
  • Deployment: No R server or Shiny server is required

Prerequisites

  • Python, numpy, pandas, shinylive, jupyter
  • R, shiny, shinylive, quarto, reticulate
  • Quarto + shinylive-extension

Conversion to shinylive

library(reticulate)
library(quarto)
reticulate::use_virtualenv("~/shinylive-env", required = TRUE)
system("quarto add quarto-ext/shinylive --no-prompt")
shinylive::assets_download() # recommended, otherwise 1st time automatically

quarto::quarto_render("simbiose-w.qmd")


  • Linux: straightforward
  • Windows: good experience with miniconda
  • Installation issues like download timeout, environment variables and long path names are solvable.

Advantages and Challenges of Web-R


Advantages

  • Runs on any web server, including static ones
  • No need for a dedicated Shiny server

Challenges

  • Startup delay: All required packages must be loaded from the web
  • Package availability: Some R packages, like deSolve, are not compatible with Web-R

Solution

  • Simplify code and reduce dependencies
  • Use base graphics instead of heavier packages like ggplot2
  • Implement a standalone ODE45 solver in pure R to replace unavailable packages

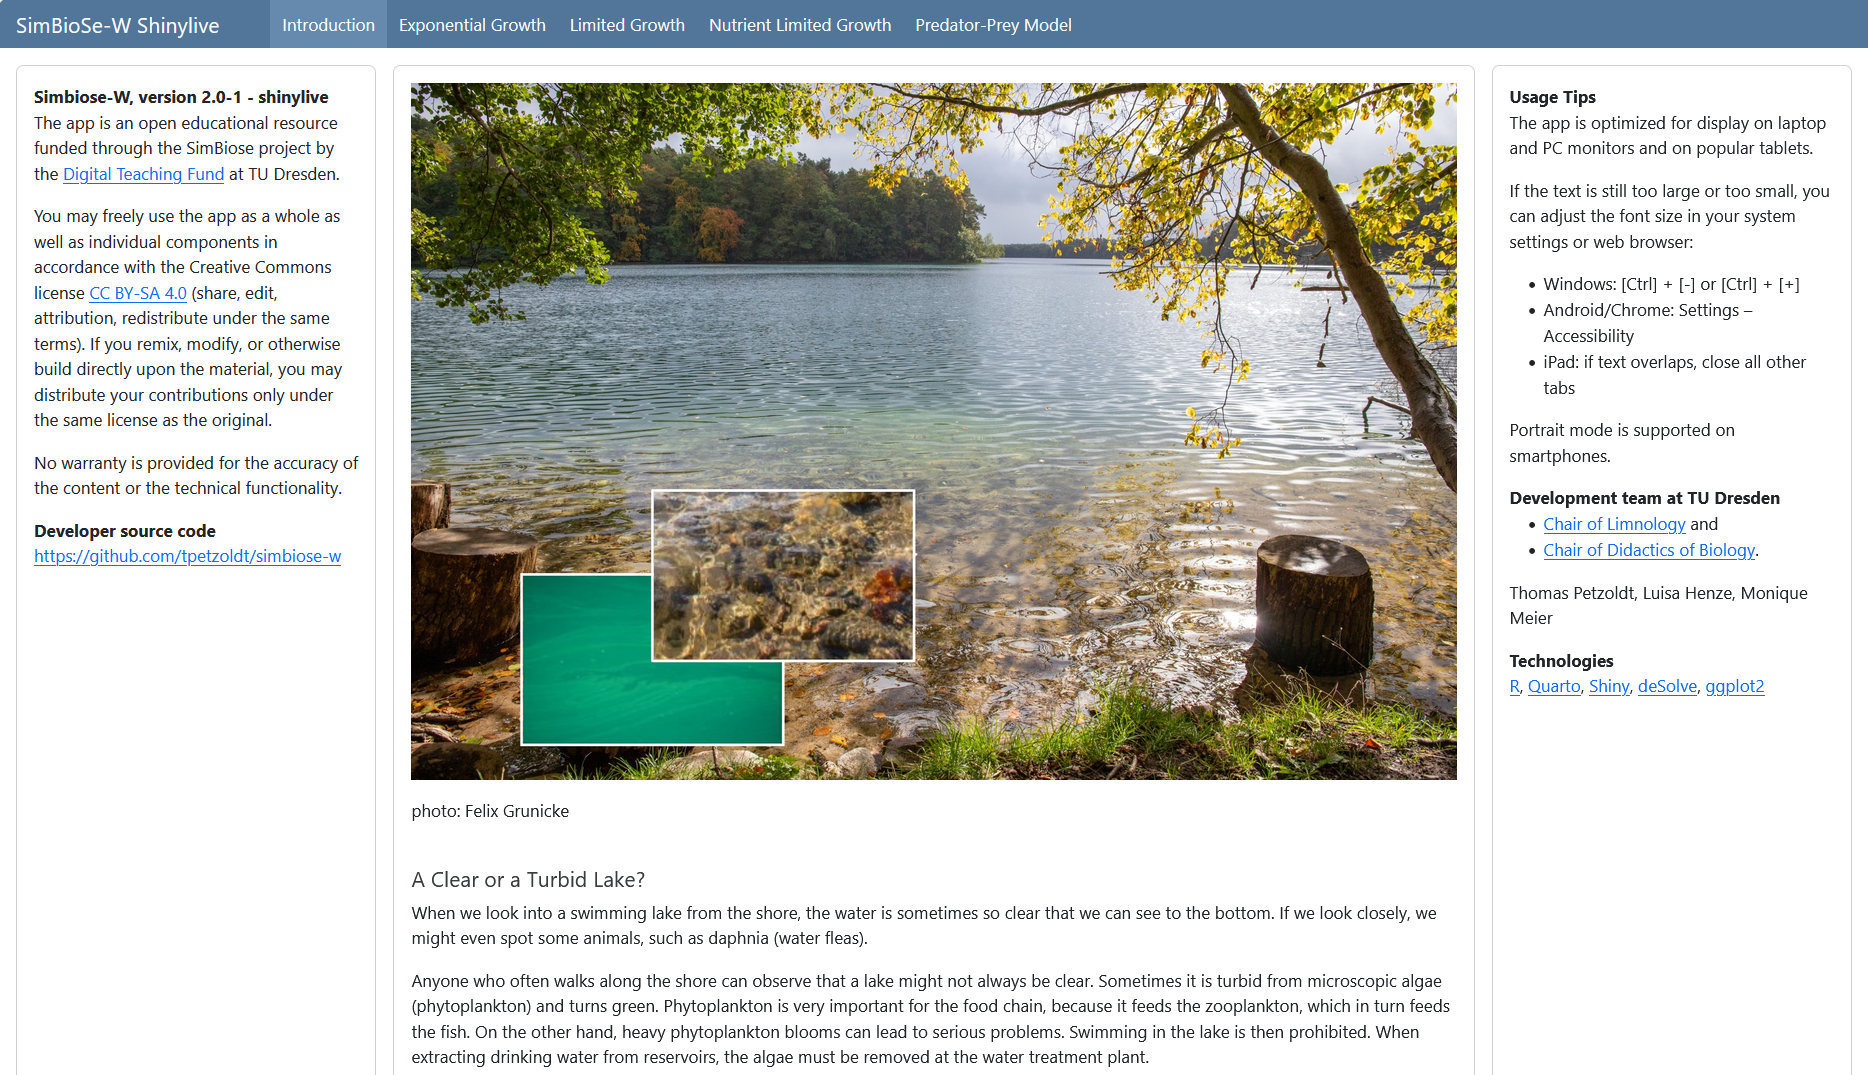
Demo

https://tpetzoldt.github.io/simbiose-w/

Conclusions

Pros and Cons


Property Complex Shiny Apps Quarto Dashboards with Shiny Shinylive Apps
Full Power of R Full access to R’s capabilities, including compiled code. Full access to R’s capabilities, including compiled code. Supports WASM-compatible R packages and user-level code.
Implementation Full flexibility, supports backend code (e.g. compiled binaries) and database access. Flexible and consistent layout; supports backends and database access. Runs entirely in the browser, no backend or database access, startup delay.
Ease of Implementation Requires significant expertise in Shiny, R, and web development, especially for maintenance. Easy to implement and maintain; Quarto simplifies layout and integration. Easy to implement, no server setup required, apps can be deployed as static files.
Server Infrastructure Requires Shiny Server or Posit Connect for deployment. May need scaling of CPU and memory. Requires Shiny Server or Posit Connect for deployment. May need scaling of CPU and memory Scales effortlessly as apps run entirely in the browser.
Integration of Code and Tutorials Allows complex applications, but may require external tutorials or handouts. Integration of code, text, and interactivity in a single document; ideal for teaching. No dependency on specific maintainer and server provider; excellent for didactic purposes.

Summary

  1. Complex Shiny Apps
    • For complex applications requiring backend integration, databases, etc.
    • High flexibility but significant technical and implementation overhead.
  2. Quarto Dashboards with Shiny
    • Balance between complexity and ease of use.
    • Text, visualization, and interactivity in a single document.
  3. Shinylive Apps
    • Best for lightweight applications that run entirely in the browser.
    • Ensures longevity of tutorials, independent of external hosting, no CPU scaling issues.
  4. Dashboards with Shinylive
    • Combines advantages of Quarto Dashboards and Shinylive.
    • A highly appealing approach for teaching apps of medium complexity.

Acknowledgments


  • Luisa Henze, Monique Meier, Thomas Berendonk
  • Digital Learning and Teaching Fund of TU Dresden [link]

TUD - Dresden University of Technology Institute of Hydrobiology


The R Community

https://github.com/tpetzoldt/useR2026/

This work is licensed under the Creative Commons License CC-BY 4.0