Data set discharge_normal
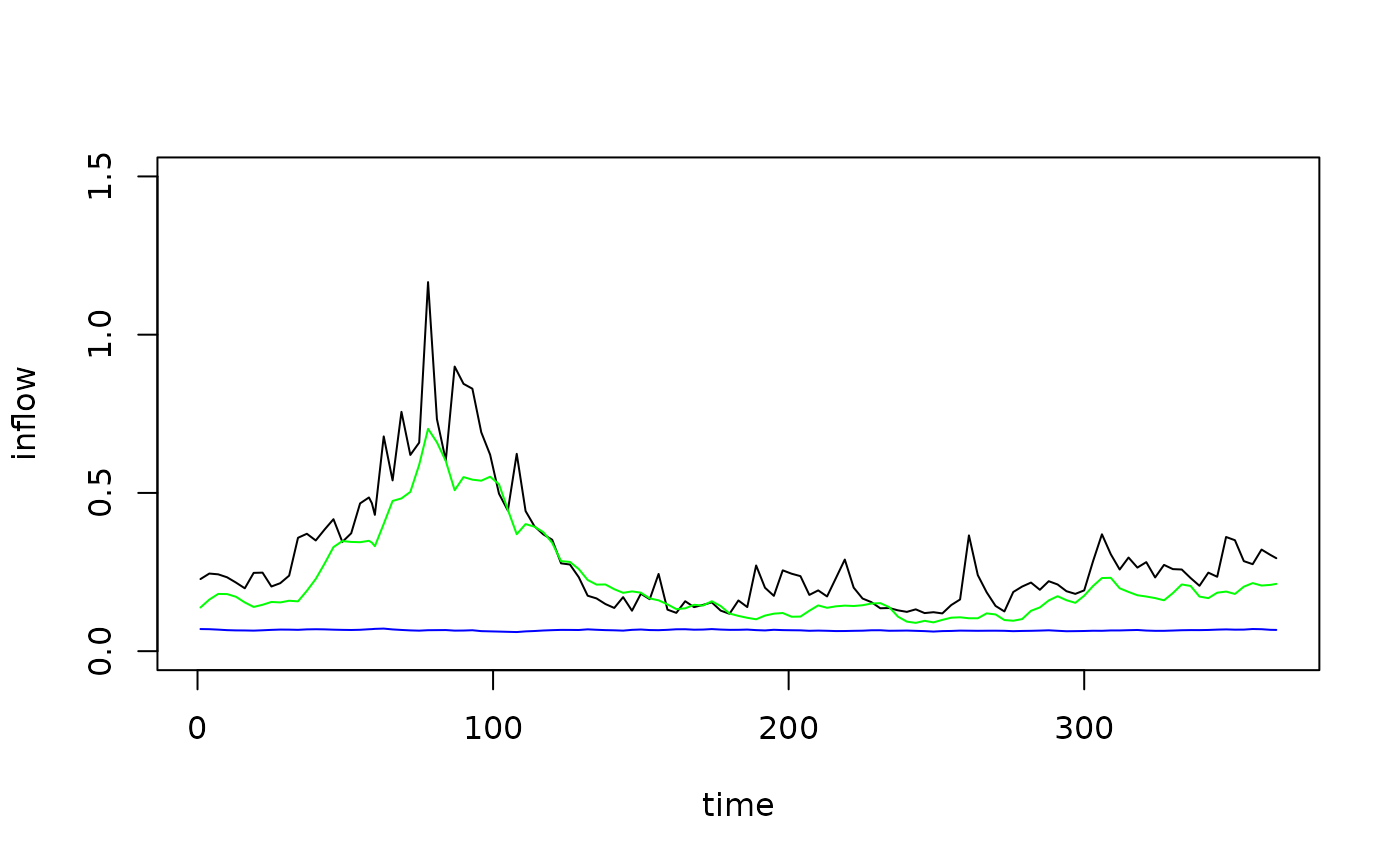
discharge_normal.RdExample Hydrological Data of d Normal Year
Example data sets with inflow and outflow of a reservoir (in Mio m3/d) of a normal, a wet and a dry year.
discharge_normal.RdExample Hydrological Data of d Normal Year
Example data sets with inflow and outflow of a reservoir (in Mio m3/d) of a normal, a wet and a dry year.