09-Time Series Basics

Applied Statistics – A Practical Course

Thomas Petzoldt

2024-11-25

Introductory examples

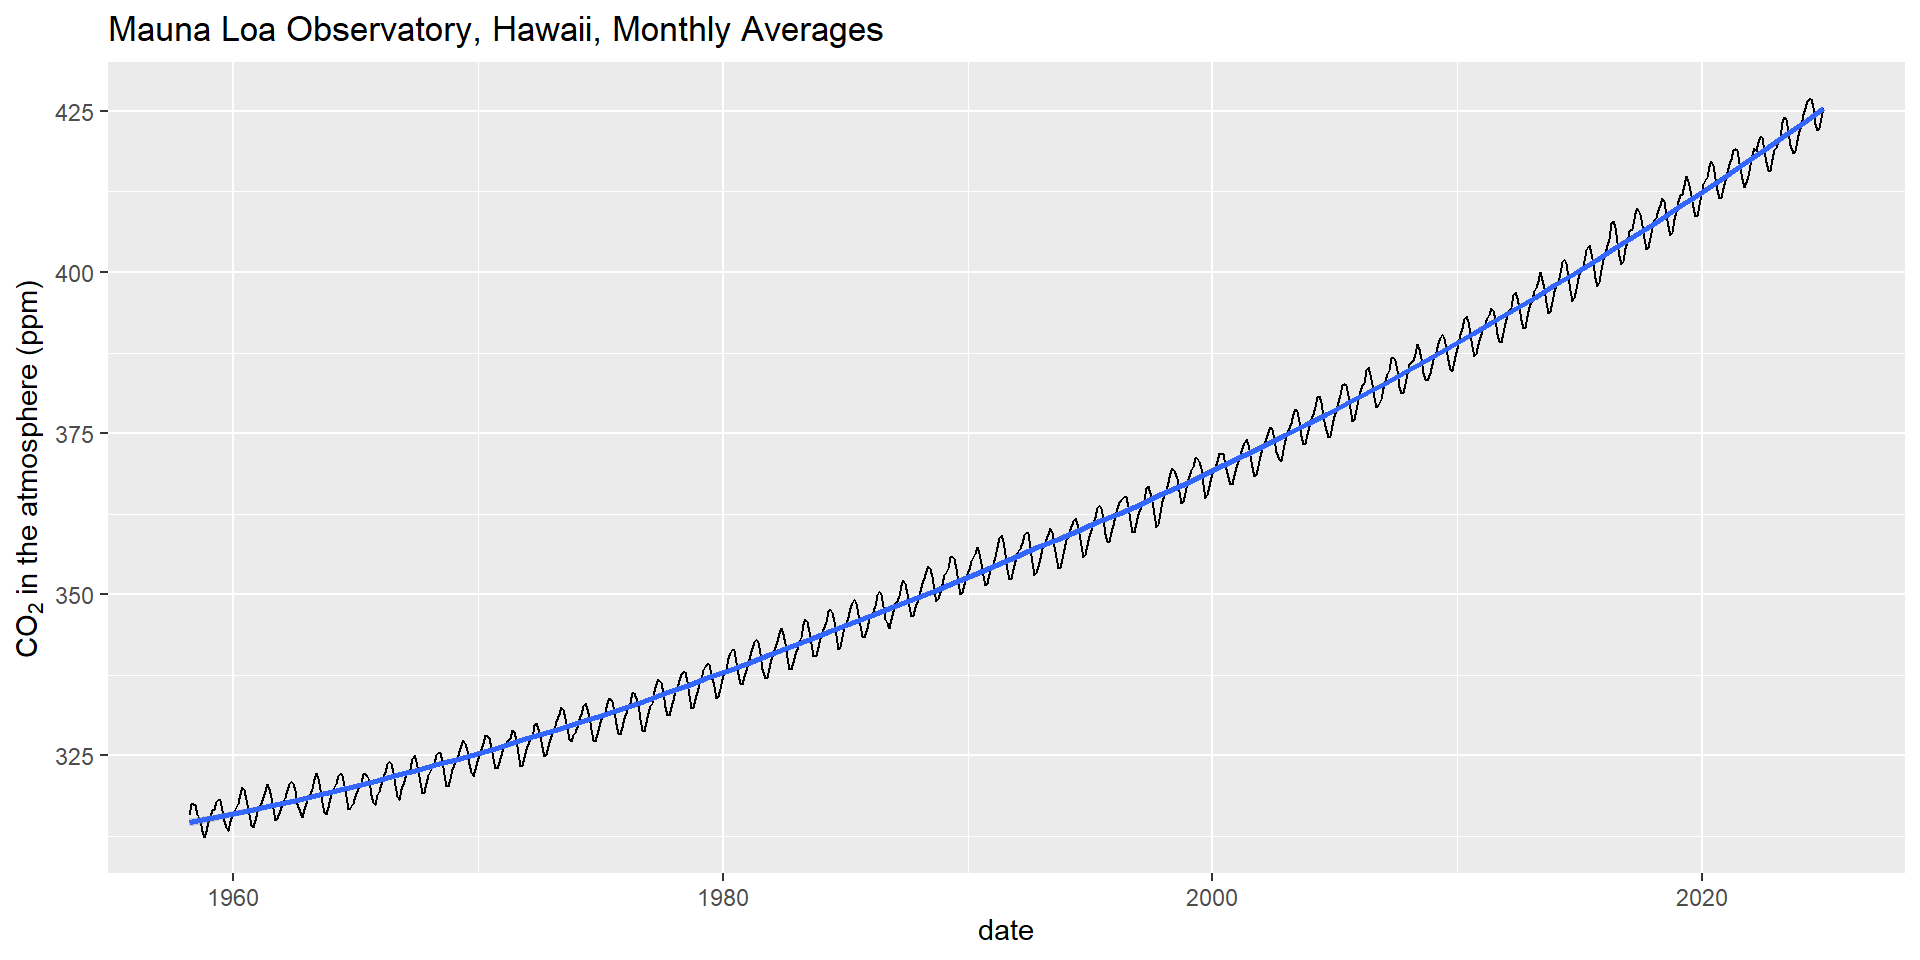
Example 1: CO2 in the atmosphere

Show the code
library(dplyr)
library(readr)
library(ggplot2)
library(lubridate)

co2 <- read_csv("https://gml.noaa.gov/webdata/ccgg/trends/co2/co2_mm_mlo.csv", 
                skip = 40, show_col_types = FALSE)

co2 |> 
  mutate(date=as_date(paste(year, month, 15, sep="."))) |>
  ggplot(aes(date, average)) + 
  geom_line() + ylab(expression(CO[2]~"in the atmosphere (ppm)")) + 
  ggtitle("Mauna Loa Observatory, Hawaii, Monthly Averages") +
  geom_smooth()

Data source:

Keeling et al. (2001), Tans & Keeling (2023), https://gml.noaa.gov/ccgg/trends/data.html
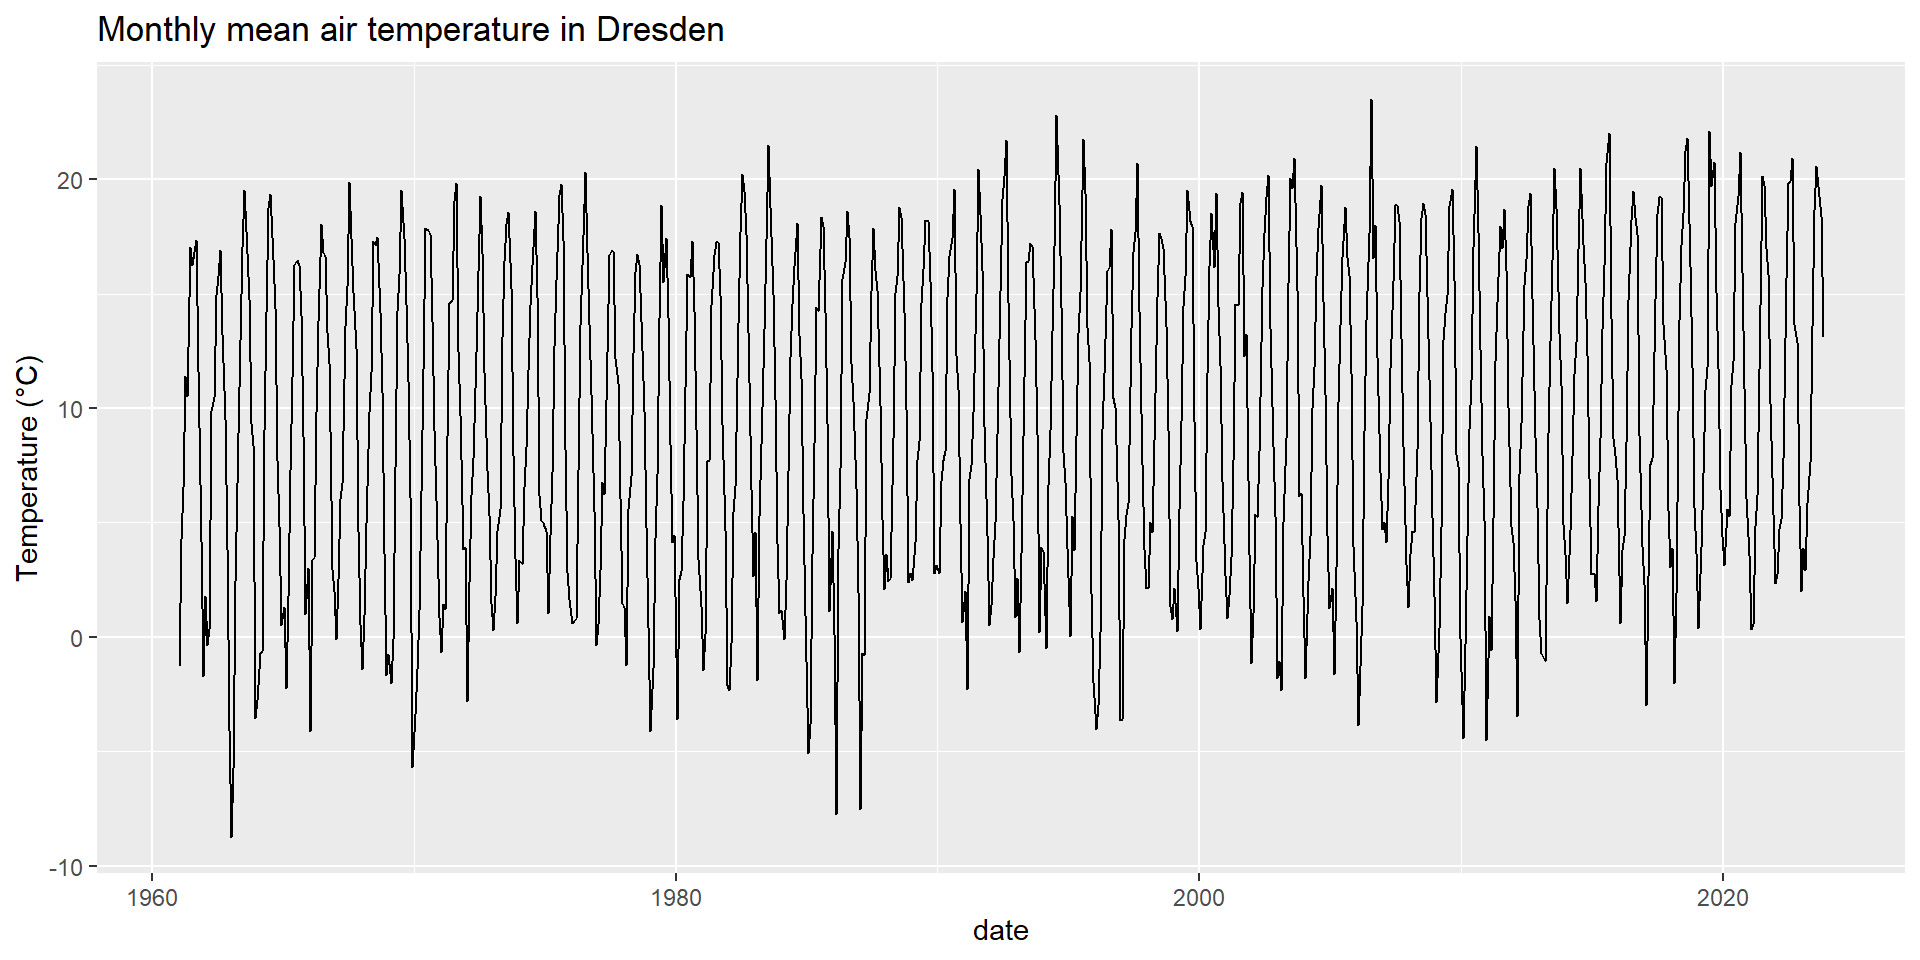
Example 2: Monthly mean air temperature

Show the code
library(dplyr)
library(readr)
library(ggplot2)
library(lubridate)

tempdata <- read_csv("../data/airtemp_dresden_daily.csv") |>
  select(ZEIT, TM) |>
  rename(date = ZEIT) |>
  mutate(year = year(date), month = month(date)) |>
  group_by(year, month) |>
  summarise(temp = mean(TM)) |>
  mutate(date = date(paste(year, month, 15, sep="-")))

tempdata |>
  ggplot(aes(date, temp)) + 
  geom_line() +
  ylab("Temperature (°C)") + 
  ggtitle("Monthly mean air temperature in Dresden")

Data downloaded from https://rekis.hydro.tu-dresden.de (Kronenberg, 2021), original source Deutscher Wetterdienst, https://www.dwd.de, data modified and averaged.

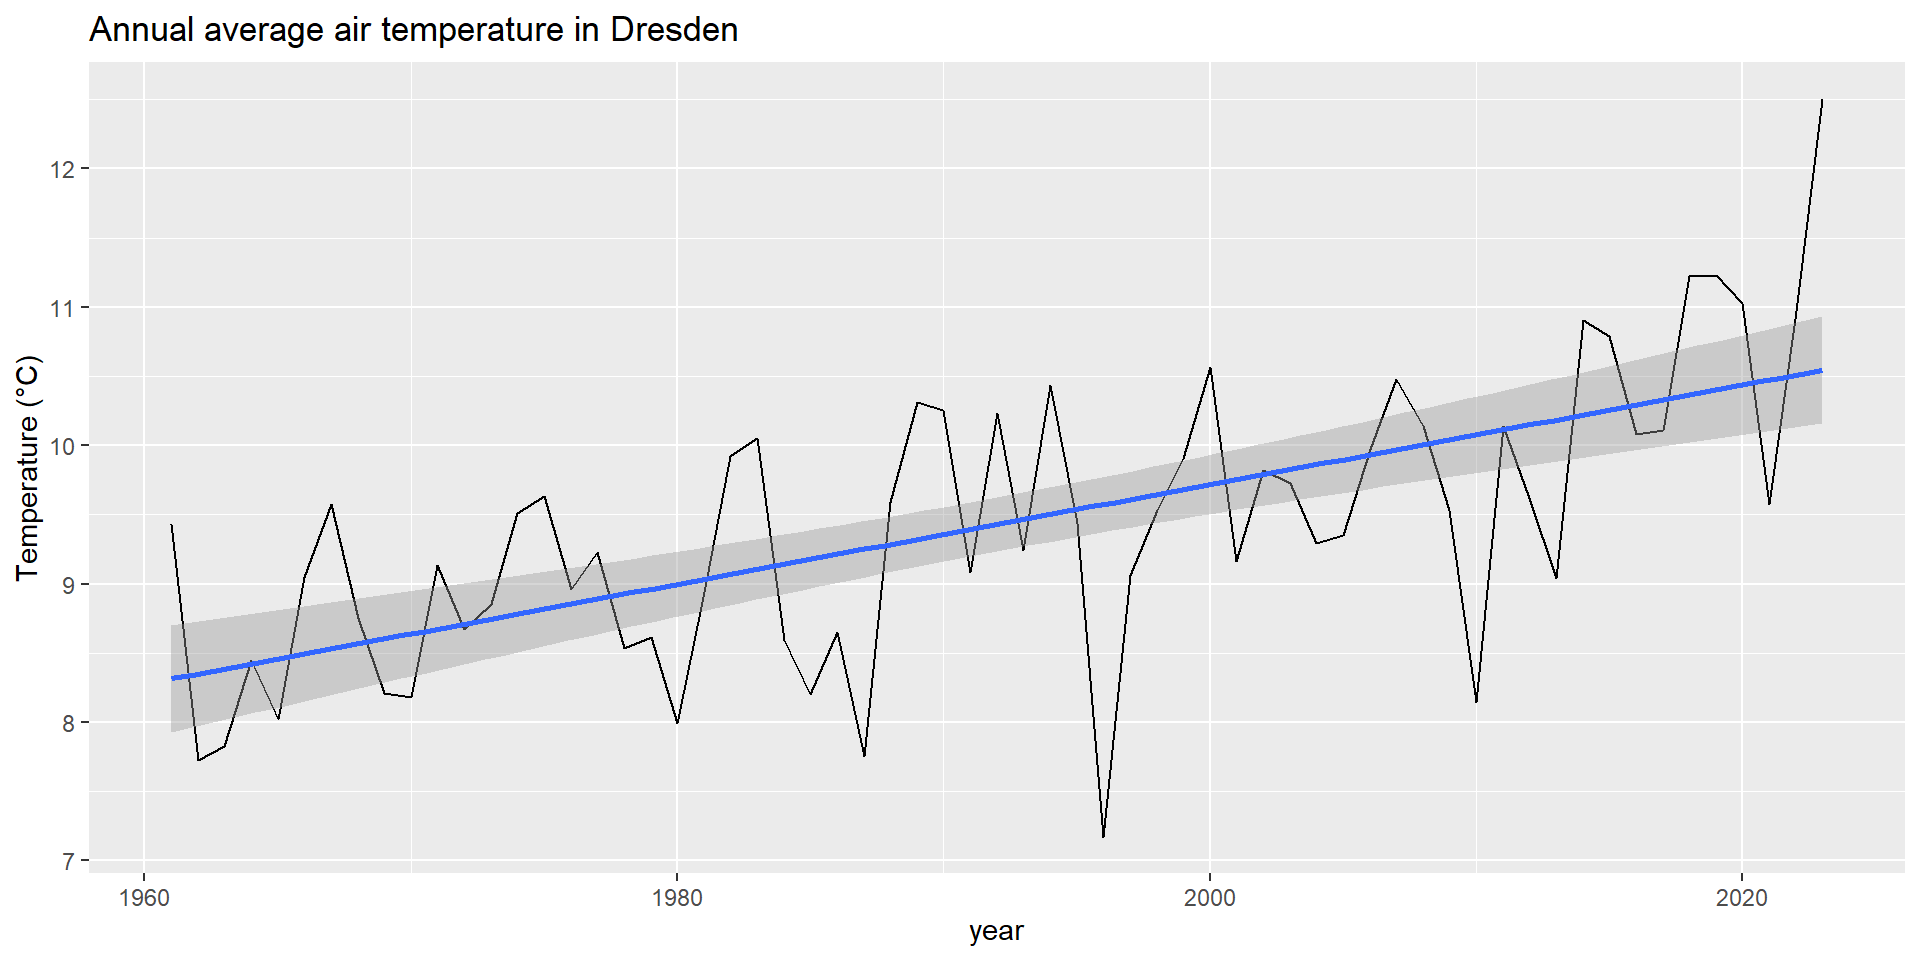
Example 3: Annual mean air temperature

Show the code
read_csv("../data/airtemp_dresden_daily.csv") |>
  select(ZEIT, TM) |>
  rename(date = ZEIT) |>
  mutate(year = year(date)) |>
  group_by(year) |>
  summarise(temp = mean(TM)) |>
  ggplot(aes(year, temp)) + 
  geom_line() +
  geom_smooth(method="lm") +
  ylab("Temperature (°C)") + 
  ggtitle("Annual average air temperature in Dresden")

Data downloaded from https://rekis.hydro.tu-dresden.de (Kronenberg, 2021), original source Deutscher Wetterdienst, https://www.dwd.de, data modified and averaged.

Characteristics of the examples


  • Observations as a function of time
  • Measurements can be serially interdependent, e.g.:
    • trend
    • seasonality
  • No “true” replicates


\(\Rightarrow\) independency assumption of simple linear regression is violated

Time series analysis


  • Deals with development of processes in time: \(x(t)\),
  • Huge number of specific approaches, only a few examples can be presented here.

Aims

  • Does a trend exist? (significance)
  • How strong is a trend? (effect size)
  • Identification of covariates (influencing factors)
  • Trend, seasonality and random error (component model)
  • Statistical modeling and forecasting
  • Breakpoint analysis, intervention analysis, …, and more

Fundamental time series concepts

Stationarity


  • Time series methods have certain assumptions.
  • One of the most common assumptions is stationarity.


Note: We are usually not primarily interested in stationarity itself!

\(\rightarrow\) It is just “the ticket” for further analyses.


Example 1: trend analysis

  • We test stationarity to check if a (simple) trend test would be appropriate.

Example 2: linear models

  • Estimation of a linear trend or a breakpoint model.
  • We check residuals for stationarity to get in formation about reliability of the fitted model.

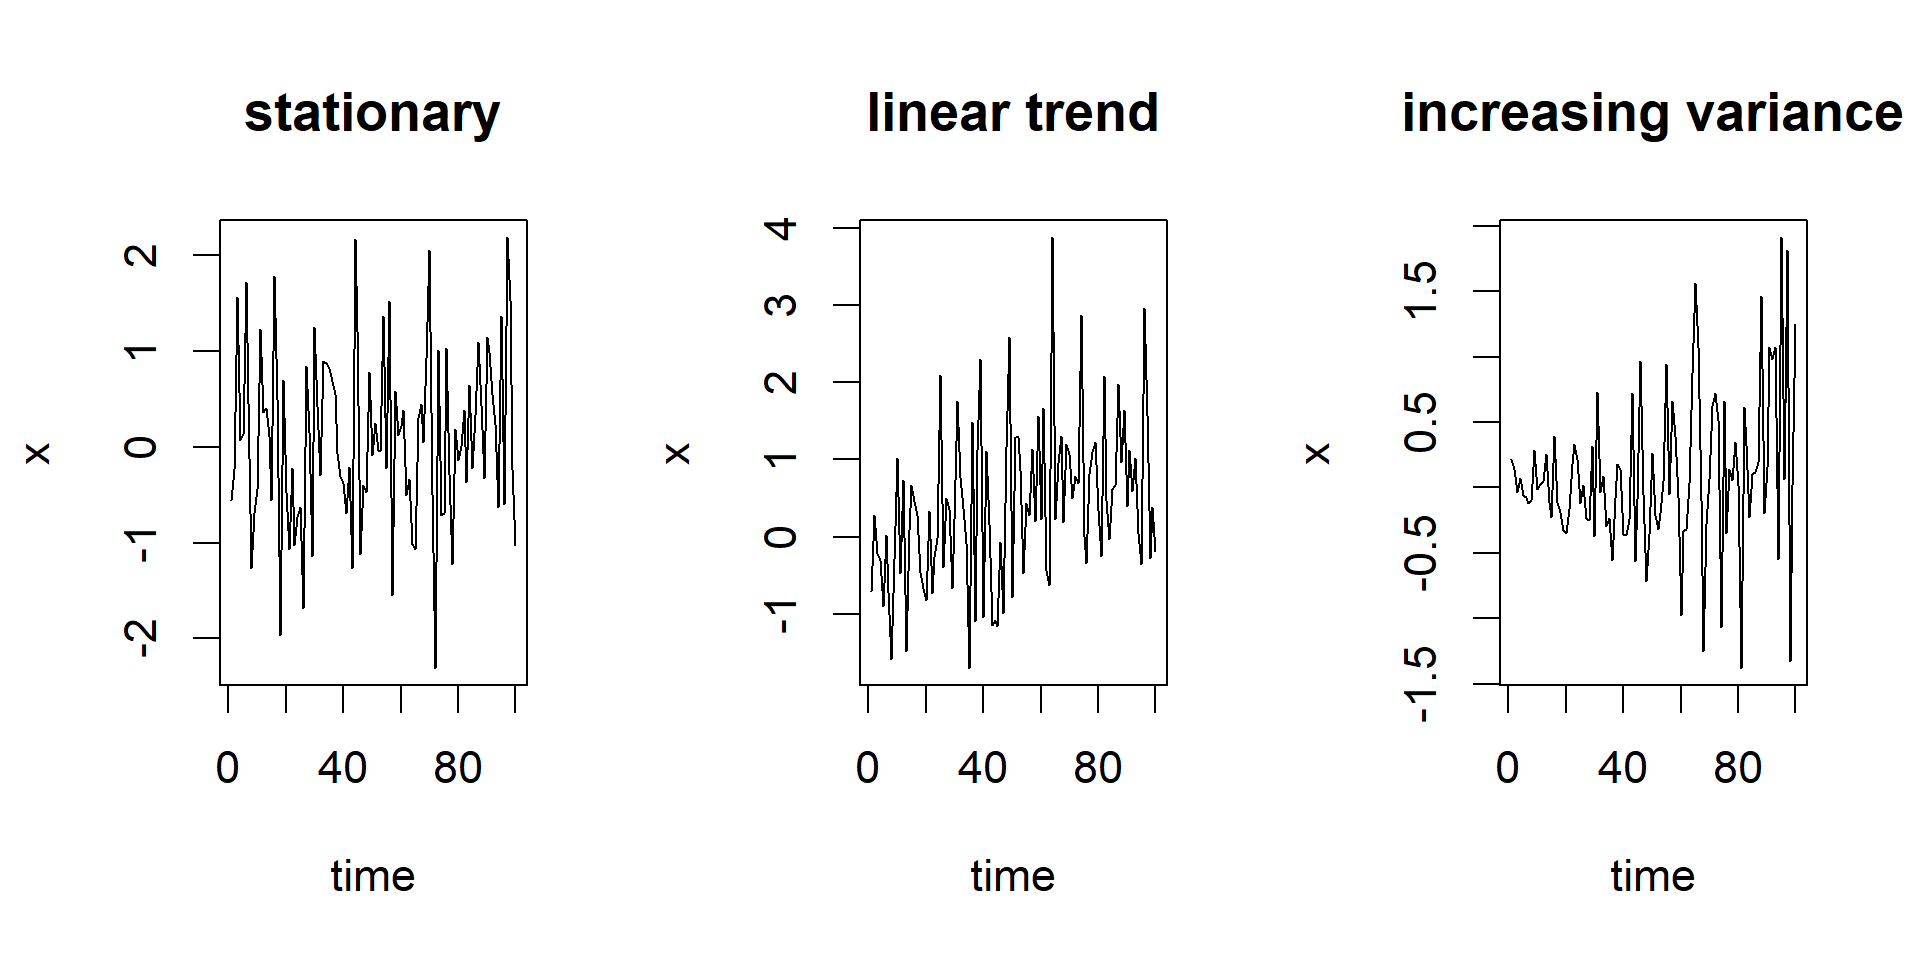
Stationarity: a central concept in time series analysis

Show the code
  set.seed(123)
  x <- 1:100
  par(mfrow = c(1, 3), cex=1.4)
  plot(x, rnorm(x), type="l", main="stationary", xlab="time", ylab="x")
  plot(x, 0.01 * x + rnorm(x), type="l", main="linear trend", xlab="time", ylab="x")
  plot(x, rnorm(x, sd=seq(0.1,1,length=100)), type="l",
    main="increasing variance", xlab="time", ylab="x")
  • Strictly or strong stationary process: distribution of \((x_{s+t})\) independent from index \(s\).
  • Wide-sense or weakly stationary processes: requires only that 1st and 2nd moments (mean, variance and covariance) do not vary with time.

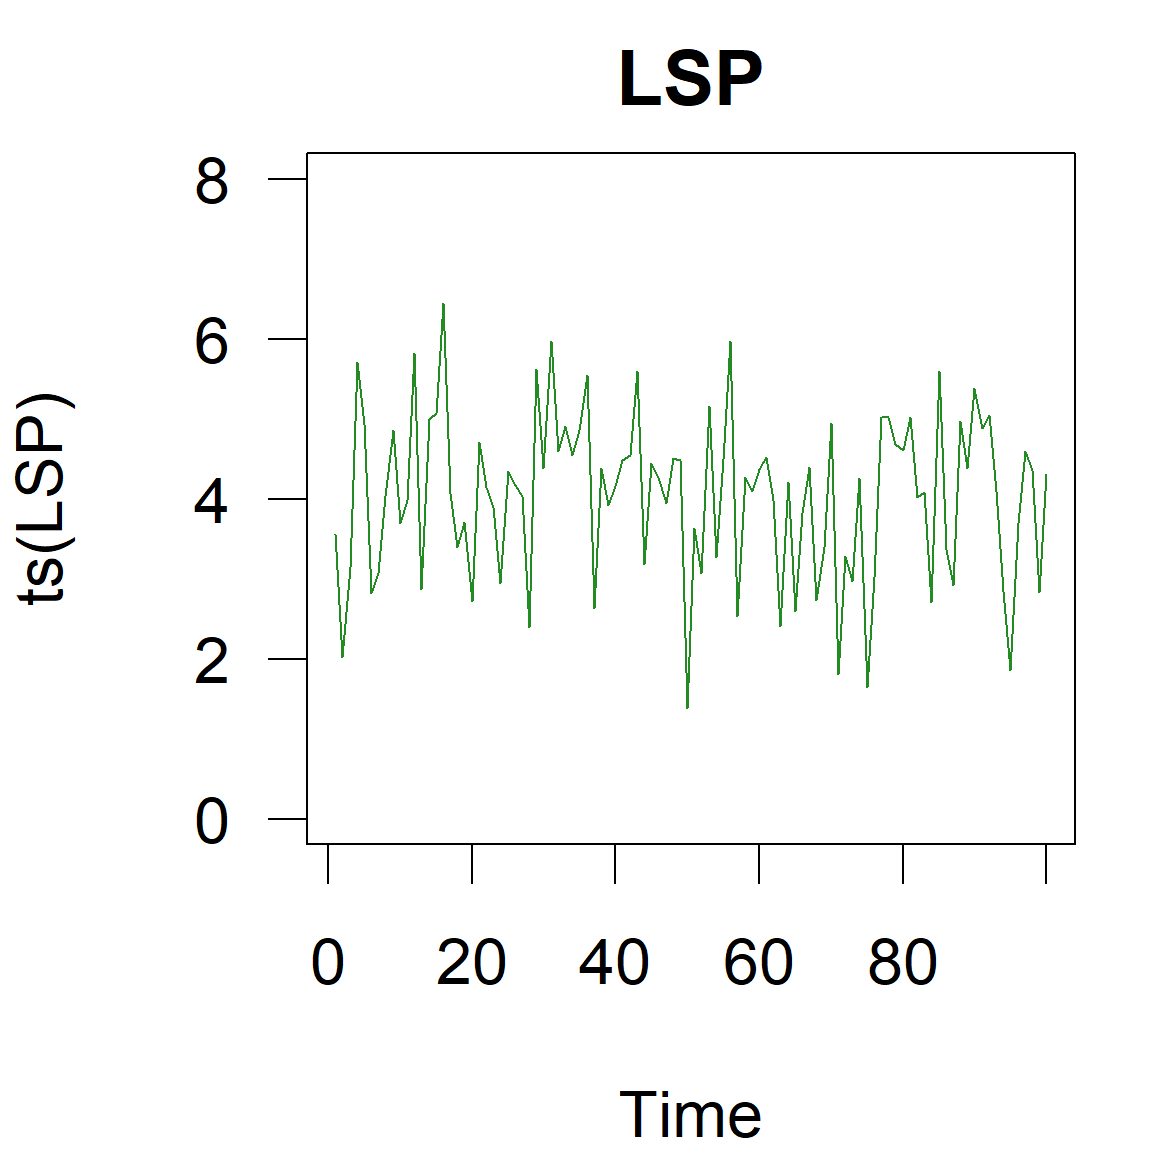
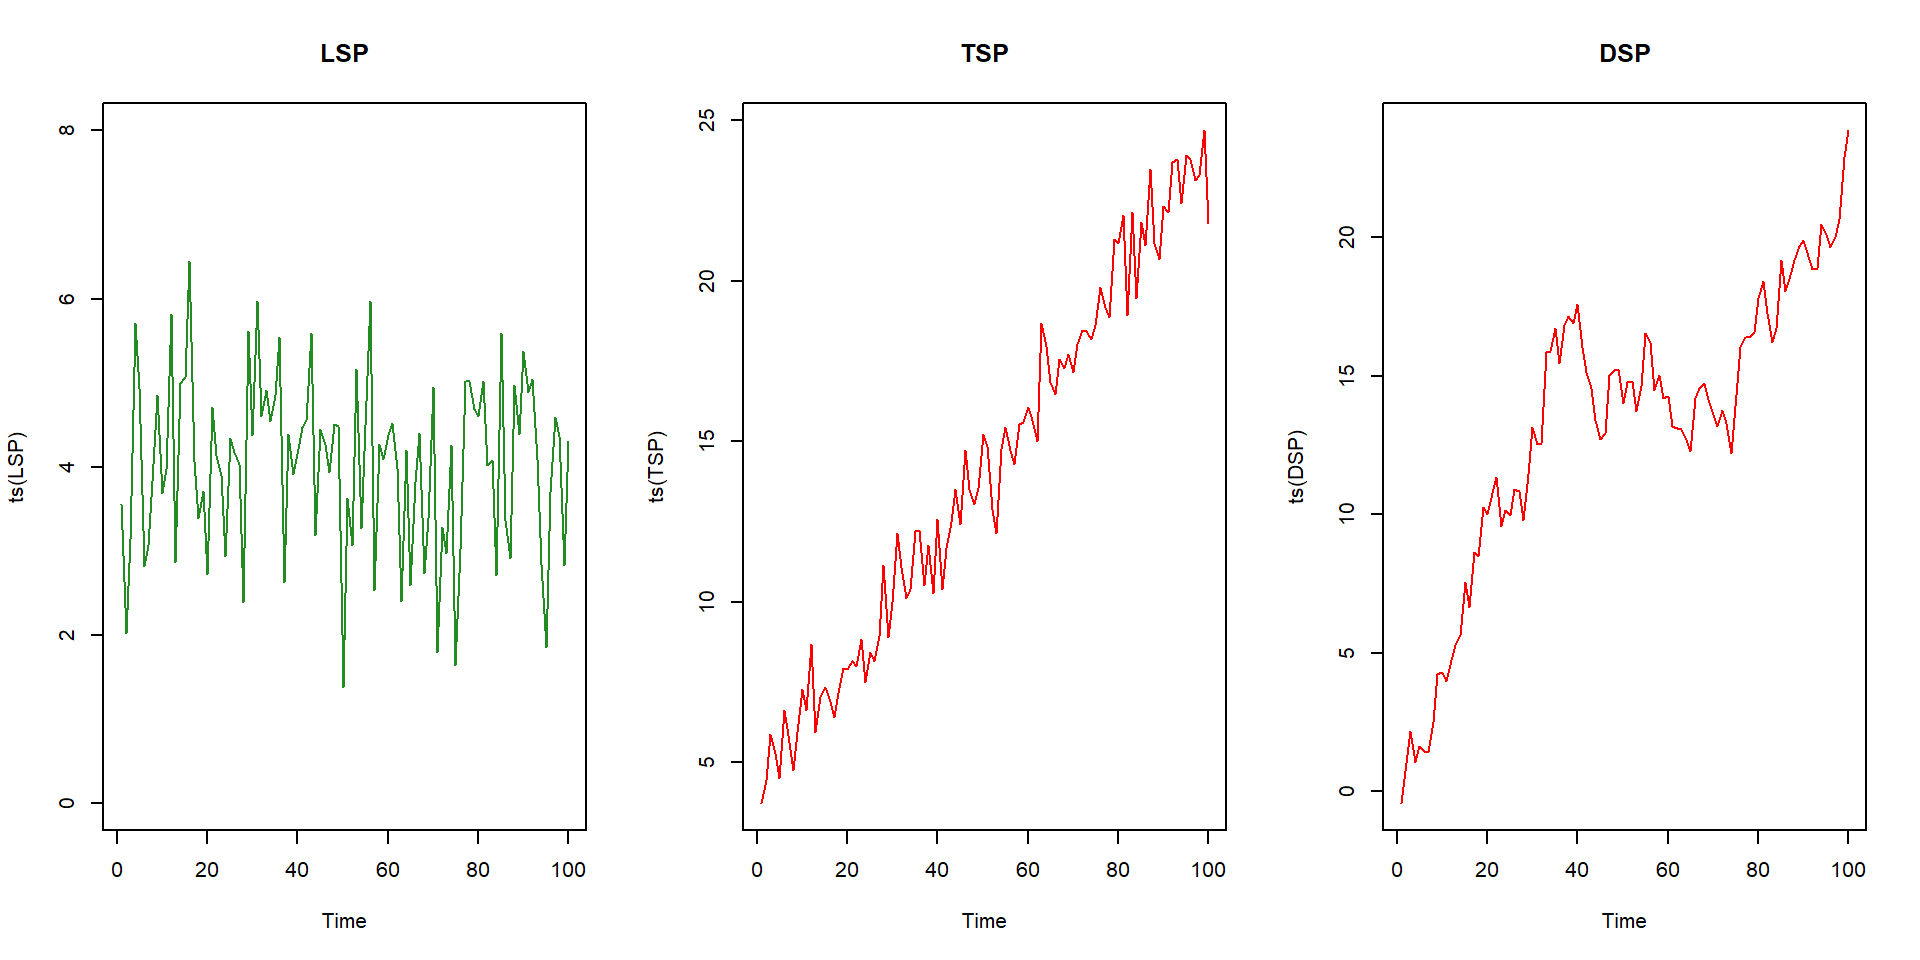
Three types of basic time series

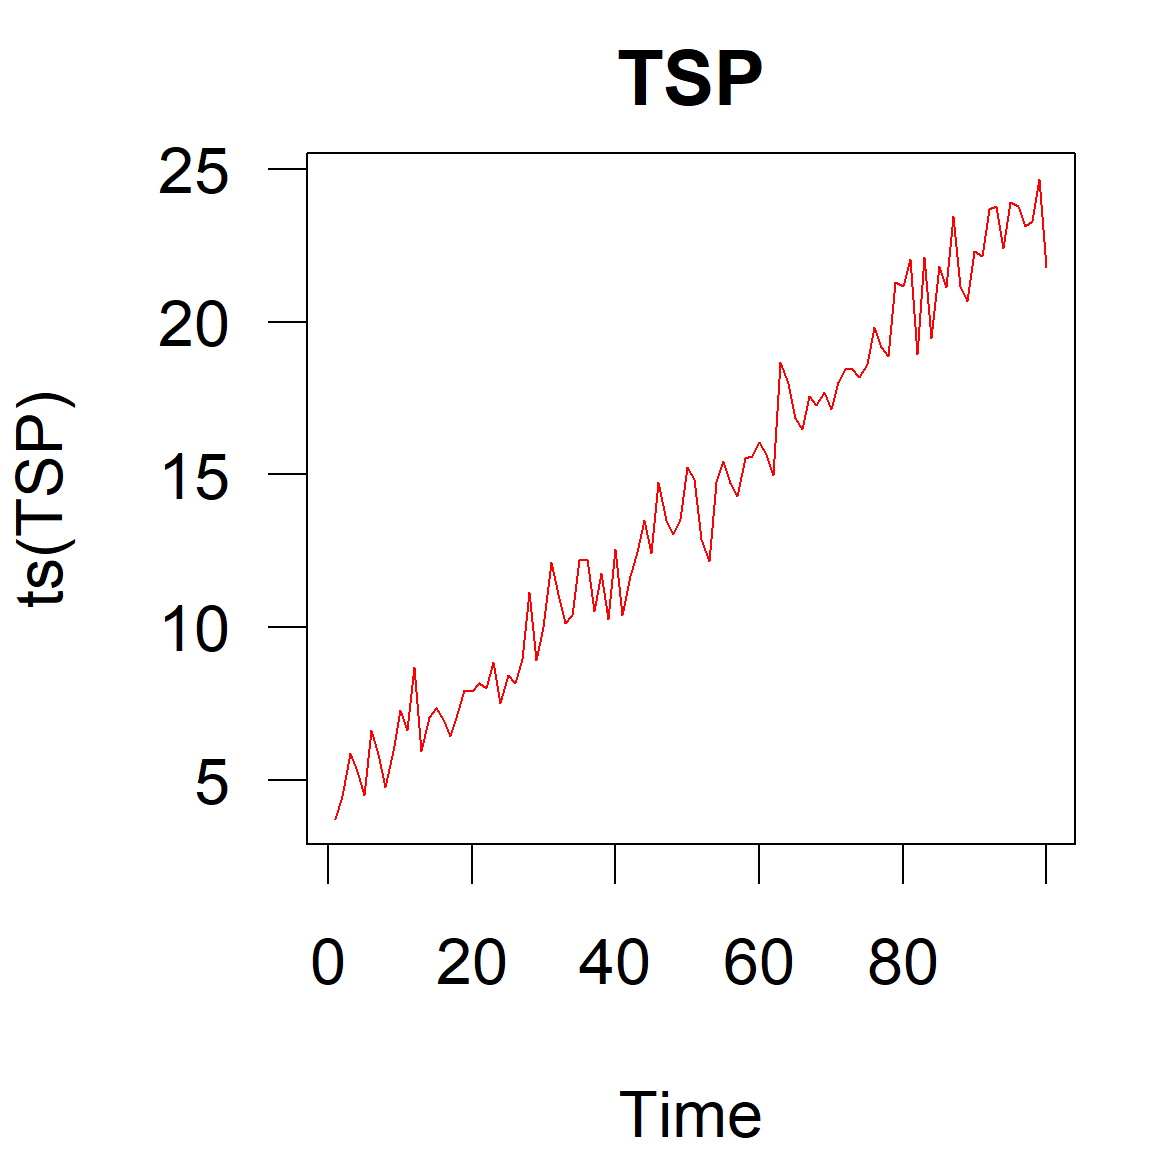
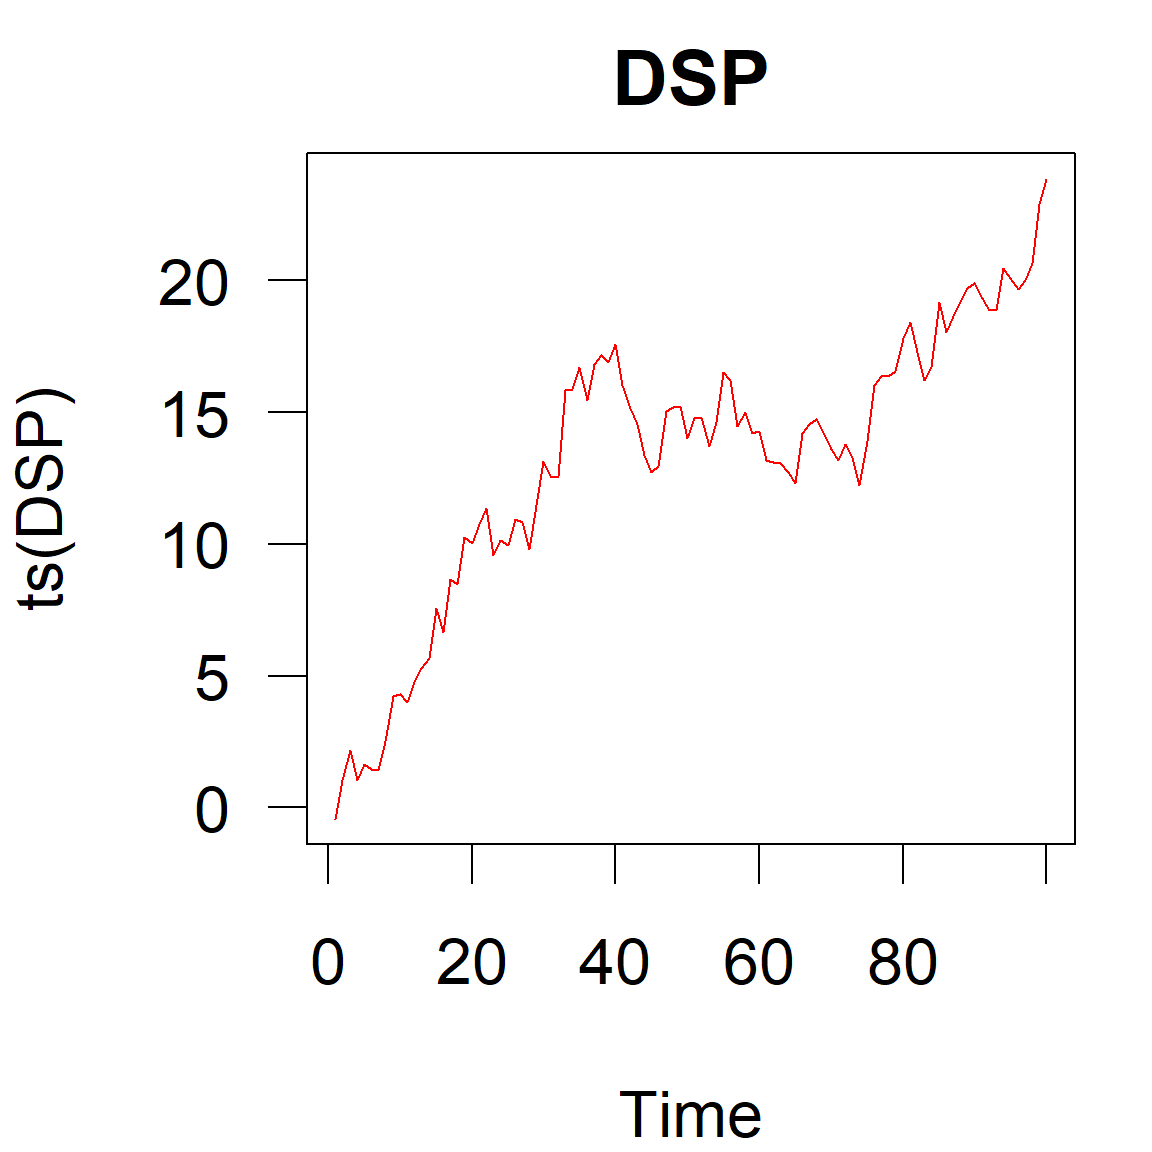
\(x_t = \beta_0 + \varepsilon_t\)

  • “level stationary process”
  • mean, variance and covariance constant
  • example: white noise
  • \(=\) stationary

\(x_t = \beta_0 + \beta_1 t + \varepsilon_t\)

  • “trend stationary process”
  • linear regression model
  • can be made stationary by detrending
  • \(\rightarrow\) non-stationary

\(x_t = x_{t-1} + c + \varepsilon_t\)

  • “difference stationary process” (random walk)
  • can be made stationary by differencing
  • \(\rightarrow\) non-stationary

Show the code
set.seed(1237)
time <- 1:100

LSP <- 4 + rnorm(time)

TSP <- 4 + 0.2 * time + rnorm(time)

DSP <- numeric(length(time))
DSP[1] <- rnorm(1)
for (tt in time[-1])  DSP[tt] <- DSP[tt-1] + 0.2 + rnorm(1)

par(mfrow=c(1,3))

plot(ts(LSP), ylim=c(0, 8), main="LSP", col = "forestgreen")
plot(ts(TSP), main="TSP", col = "red")
plot(ts(DSP), main="DSP", col = "red")

Why is this important?


Simple linear models require “independent data”, or,
more precisely: independence of residuals.

But

  • time series observations can be serially dependent
  • dependent data have “less value” (contain less information than independent data)
  • important for calculation of degrees of freedom for the sigificance tests


Approaches

  1. measure serial dependency (autocorrelation)
  2. if yes, handle autocorrelation
    1. remove it, or
    2. model it

Autocorrelation

  • measures temporal dependency (memory) of observations

Autocorrelation


A time series

x_t 1 3 2 4 5 4 3 2 8 5 4 3 6 7


**Shifting to the right

x_t 1 3 2 4 5 4 3 2 8 5 4 3 6 7
x_t+1 1 3 2 4 5 4 3 2 8 5 4 3 6 7
x_t+2 1 3 2 4 5 4 3 2 8 5 4 3 6 7


Correlation between \(x_t\) and \(x_{t+1}\) and \(x_{t+2}\):

cor(df, use = "pairwise.complete.obs")[1,]
       x_t      x_t+1      x_t+2 
 1.0000000  0.1847131 -0.1411872 

In practice, autocorrelation is calculated using the acf function of R. The algorithm is somewhat different, especially the treatment of missing values, so results differ, especially for small samples.

Autocorrelation and partial autocorrelation (ACF, PACF)

Autocorrelation function (ACF): correlogram

  • … correlation between time series and its time-shifted (= lagged) versions

  • ACF considers both, direct and indirect dependency

  • PACF considers only direct effects it is called partial autocorrelation, PACF.

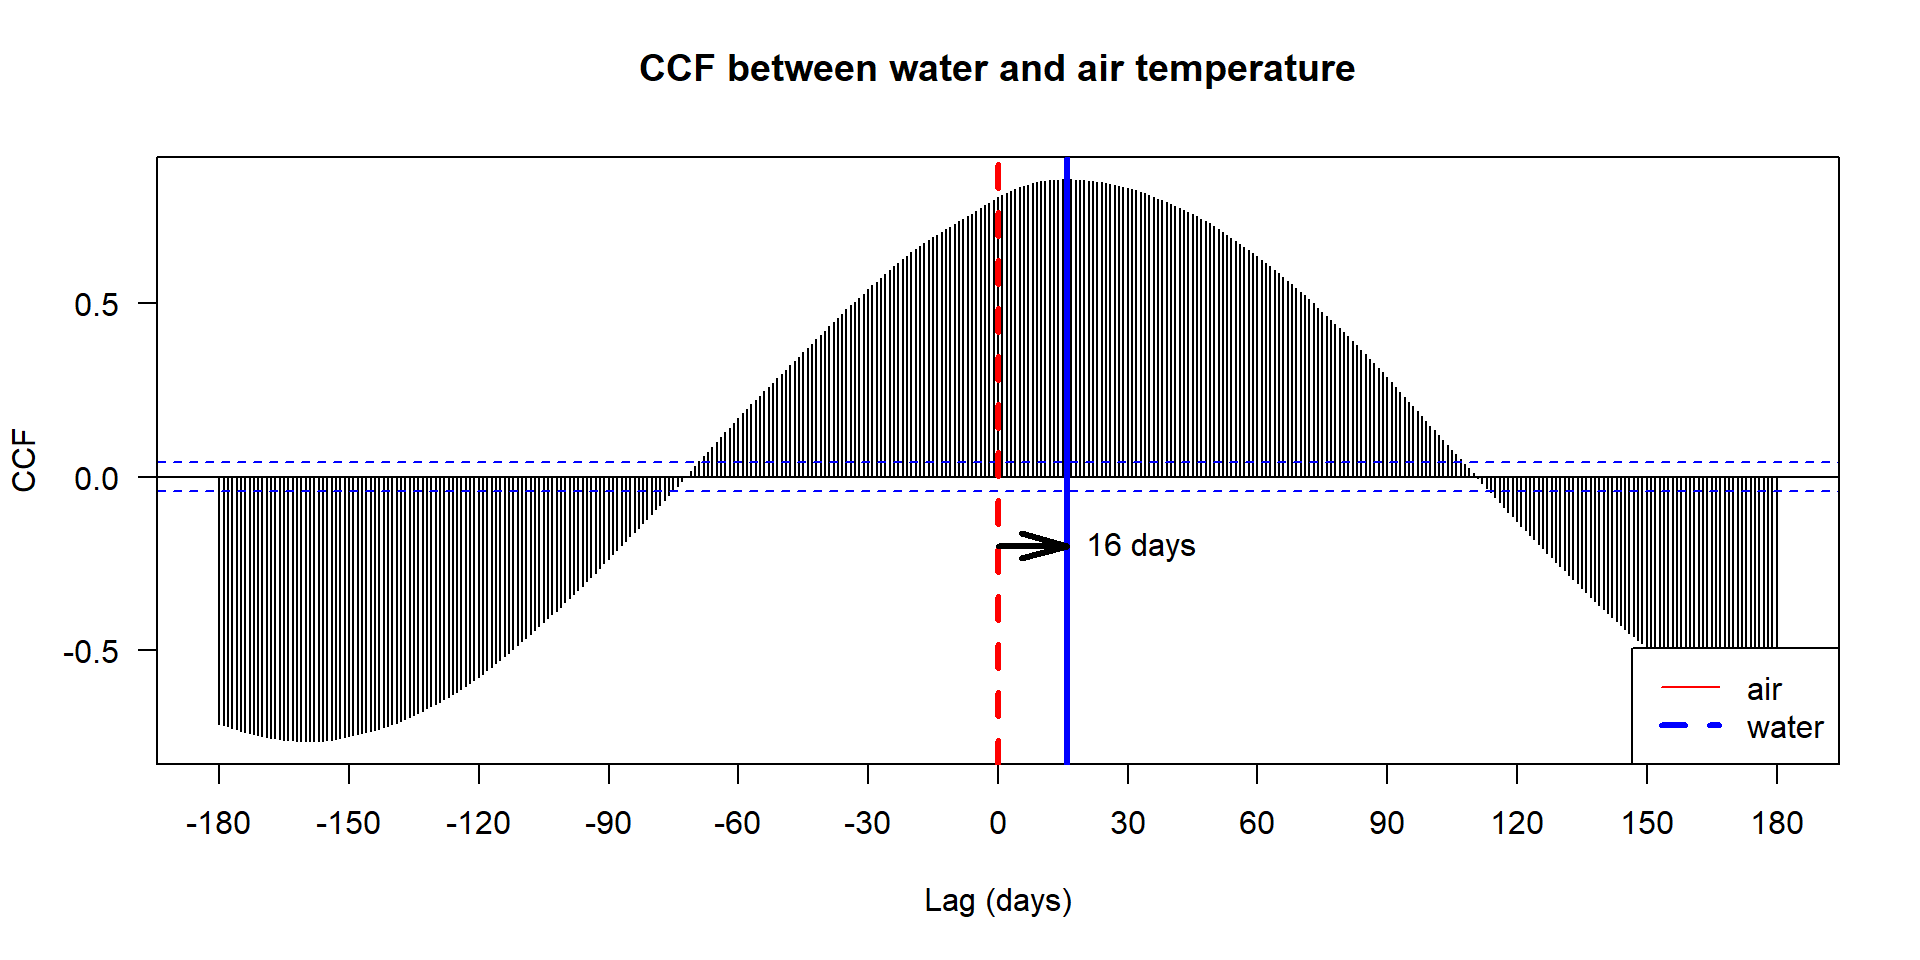
Cross-correlation (CCF)


  • time-shift between two or more variables
  • lag can be positive or negative

Examples

  • CCF between air and water temperature in rivers and lakes
  • CCF of discharge at two river kilometers \(\rightarrow\) estimate flow velocity of a flood wave

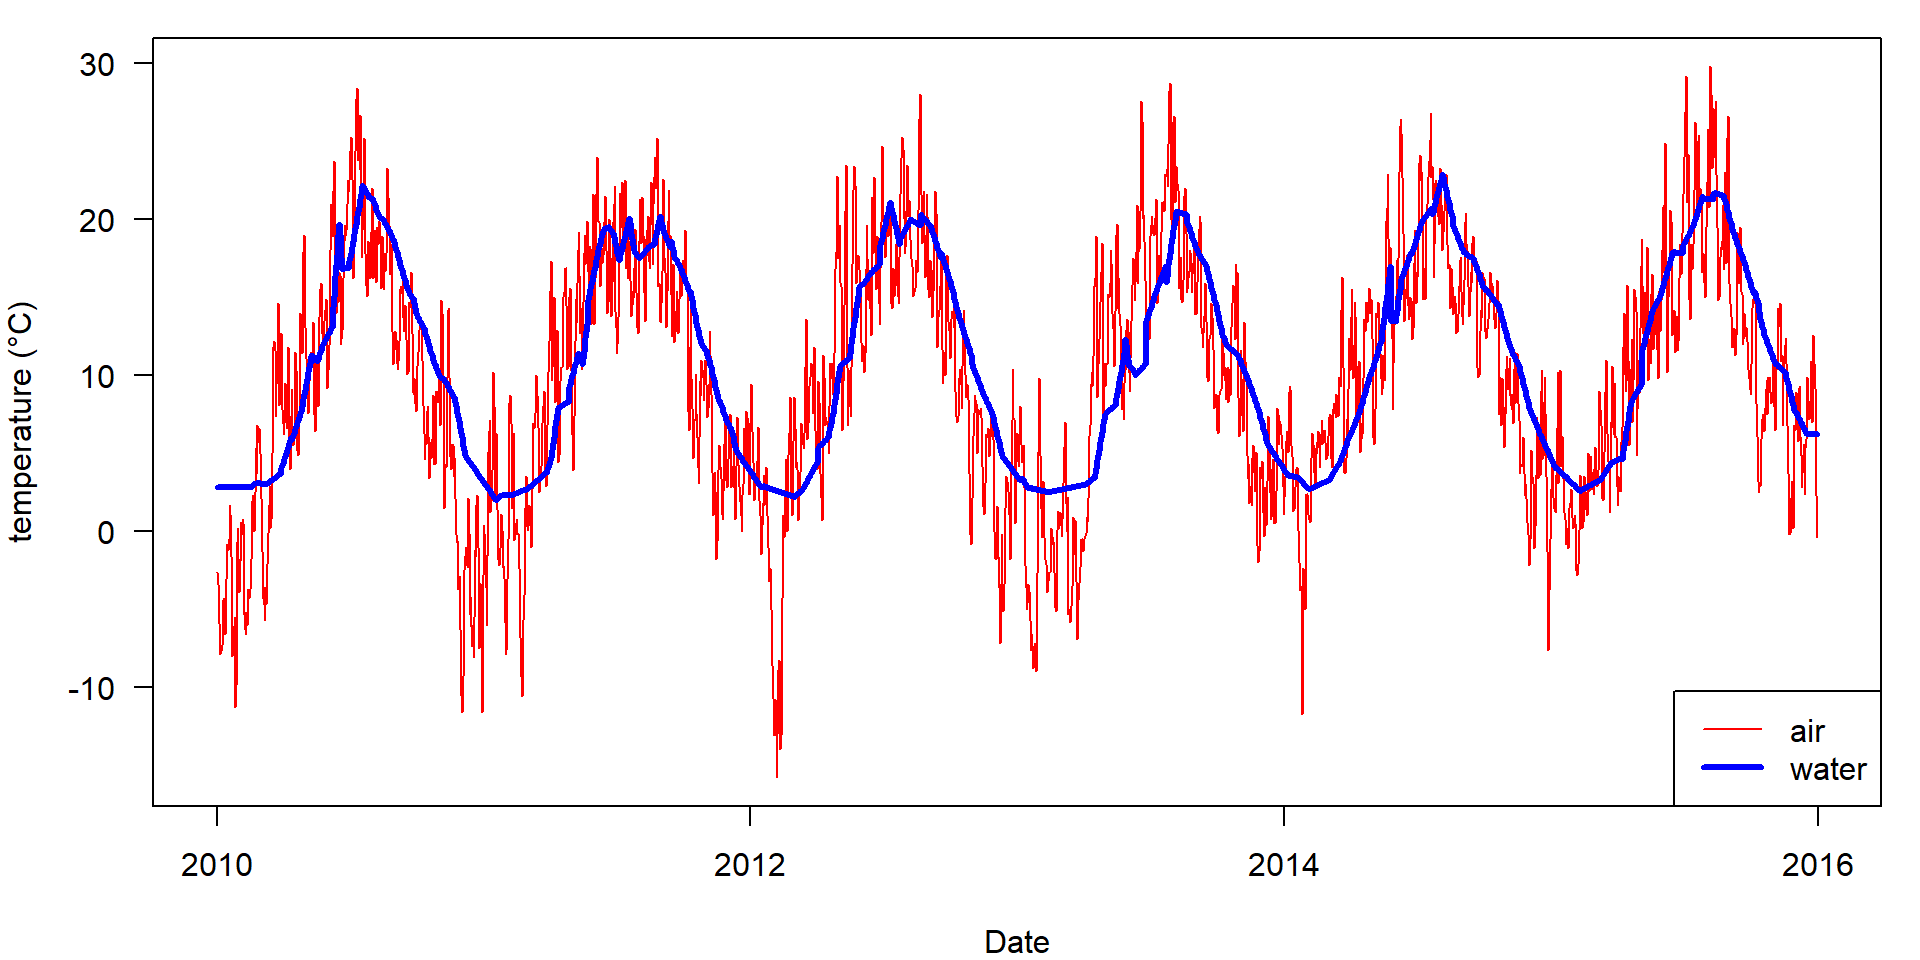
Delay between air and water temperature in a lake

  • air temperature, station Dresden-Klotsche, data from German Weather Service
  • water temperature in Saidenbach Reservoir, 5m below the surface
    (Data from Ecological Station Neunzehnhain), Horn et al. (2006), Paul et al. (2020)

Cross correlation between air and water temperature


Interpretation and removal of autocorrelation

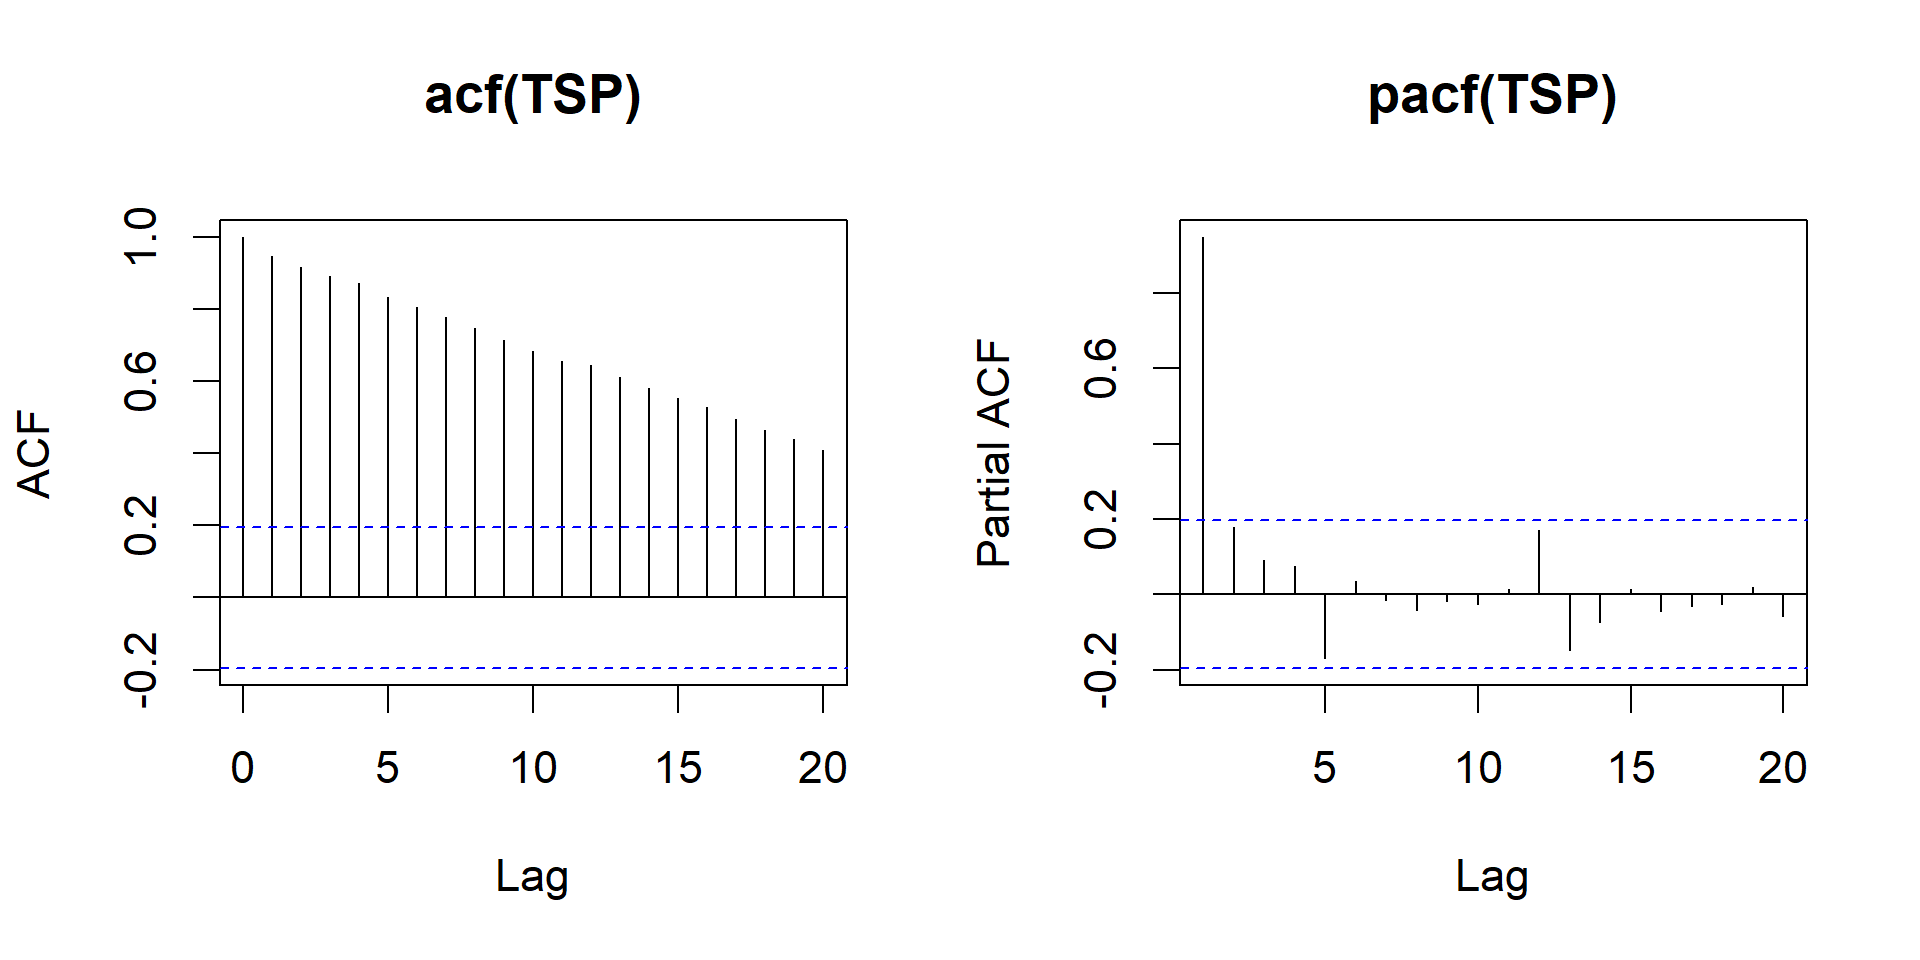
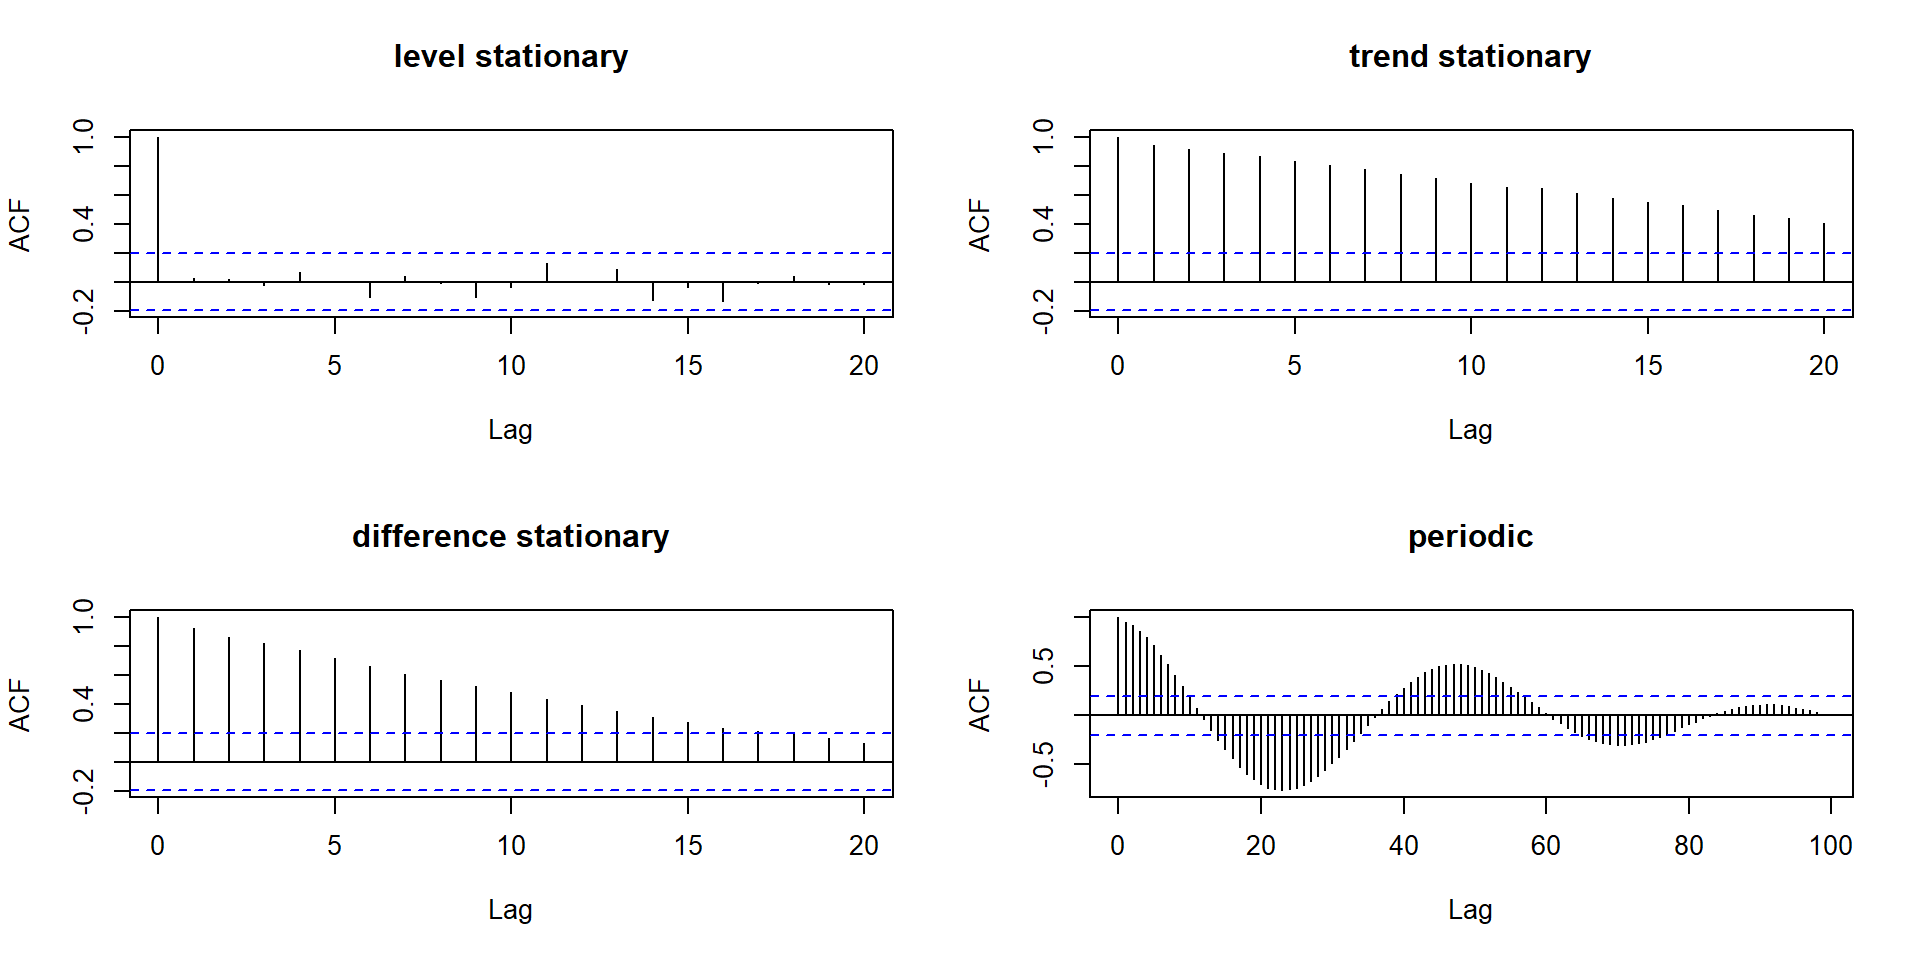
Typical patterns of ACF

Show the code
par(mfrow=c(2, 2))
acf(LSP, main = "level stationary")
acf(TSP, main = "trend stationary")
acf(DSP, main = "difference stationary")

time <- seq(0, 4 * pi, length.out = 100)
periodic <- ts(cos(time) + rnorm(100, sd = 0.1))
acf(periodic, lag = 100, main = "periodic")

Removal of autocorrelation


  • Trend stationary series: trend removal

Example:

m <- lm(TSP ~ time(TSP))
residuals(m)


  • Difference stationary series: differencing

Example:

x <- c(2, 3, 4, 3, 6, 4, 3, 8, 5, 9)
diff(x)
[1]  1  1 -1  3 -2 -1  5 -3  4


  • Periodic series: identification and removal of seasonal components

  • Methods: spectral analysis, seasonal decomposition, averaging …

Removal of autocorrelation II

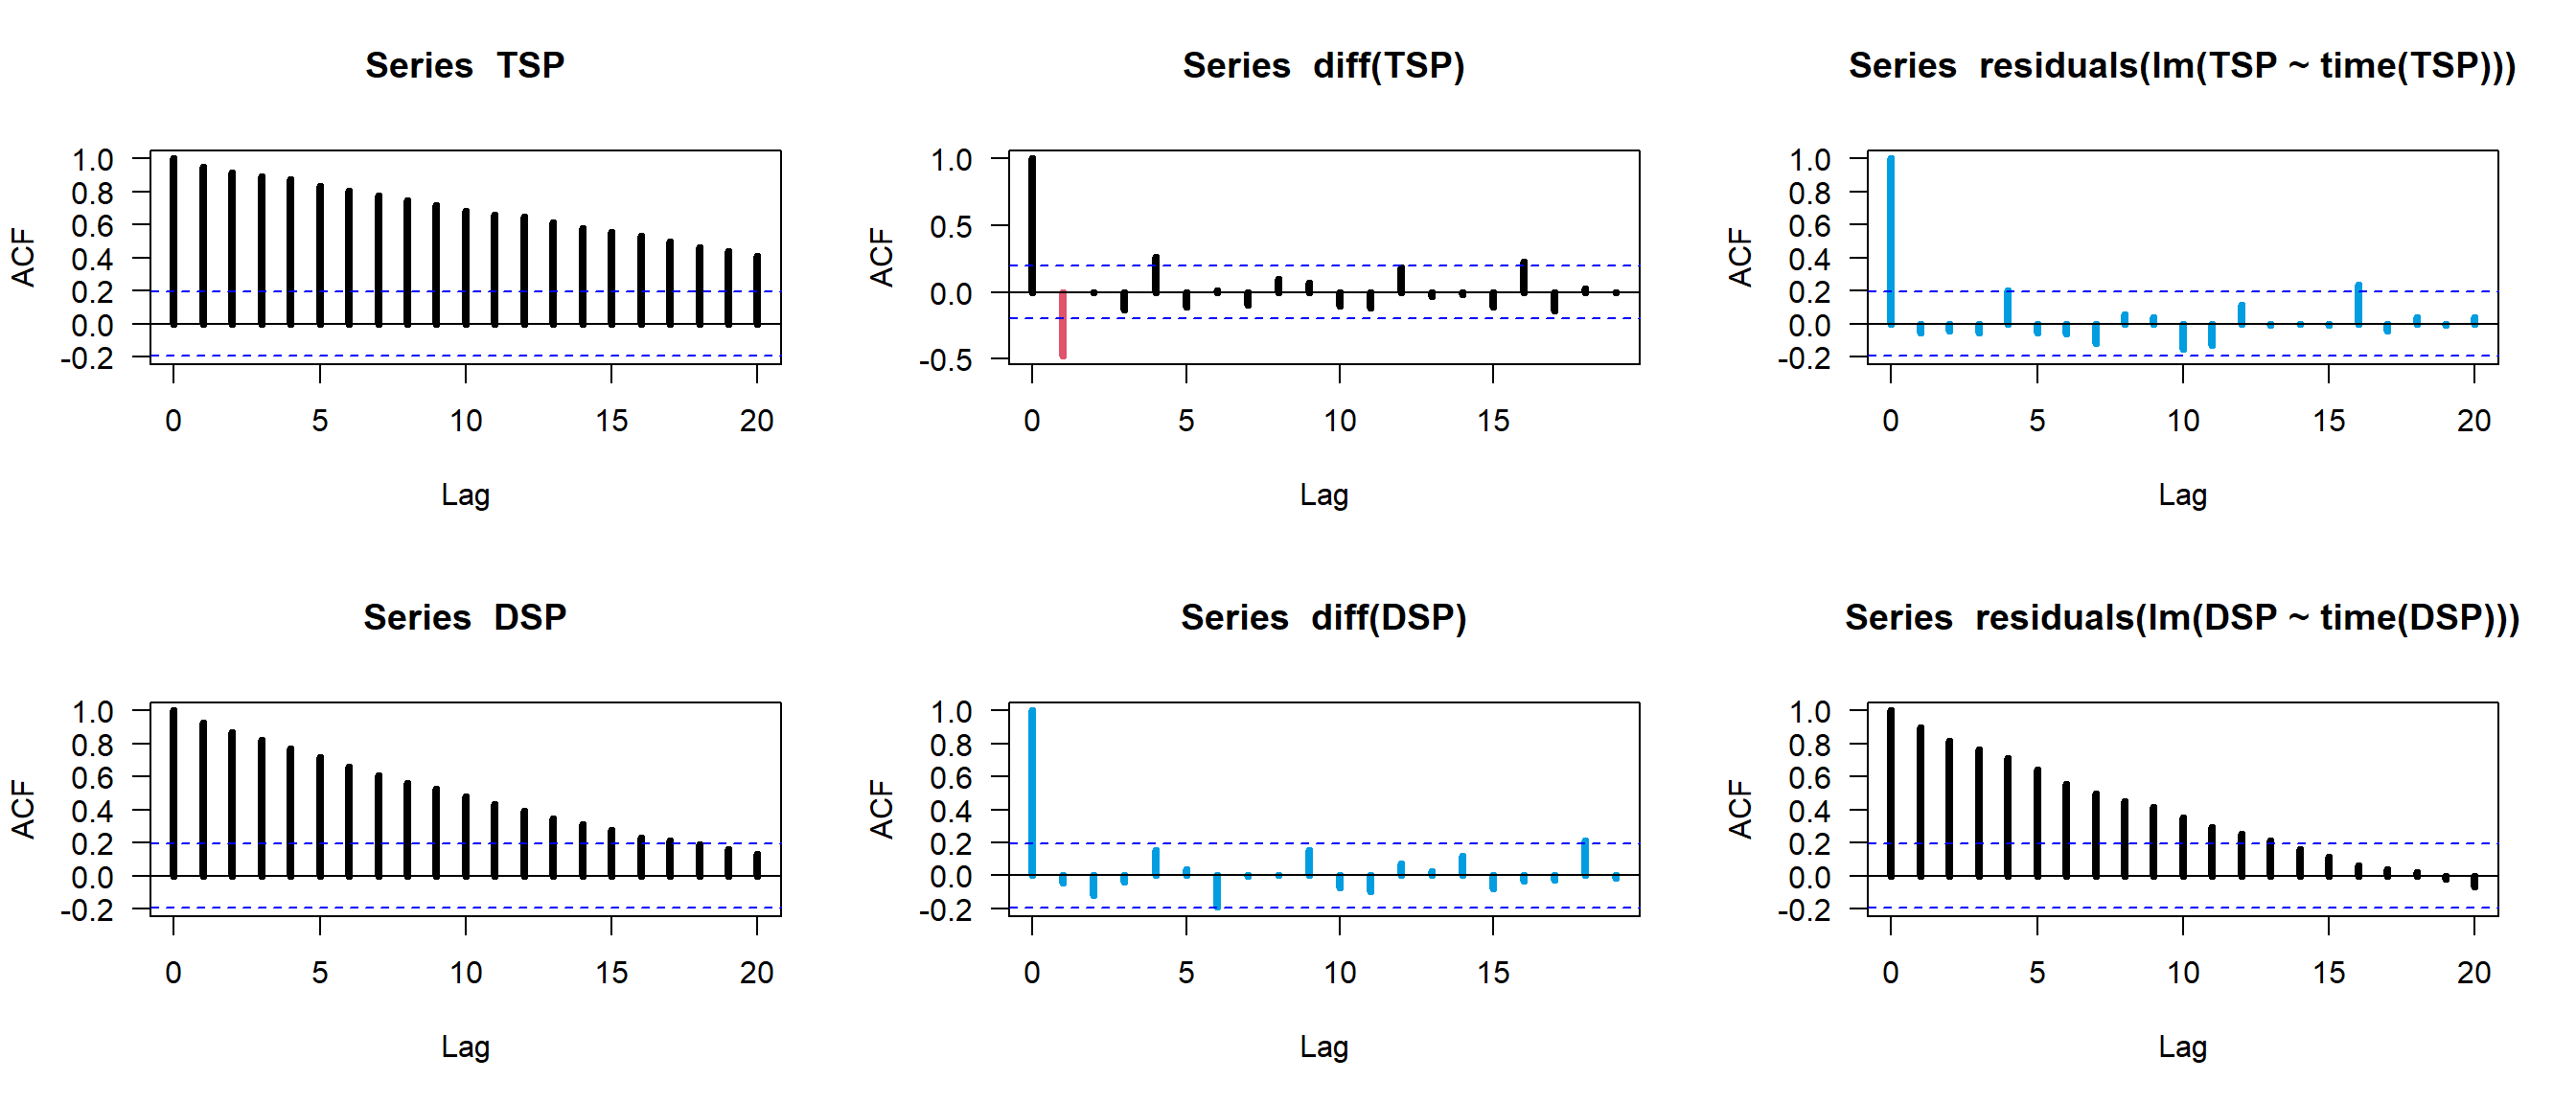
  • ACF plots of TSP and DSP
  • strong autocorrelation
  • differencing
  • differences of DSP
    \(\rightarrow\) stationary
  • detrending
  • residuals of TSP
    \(\rightarrow\) stationary

Statistical tests

Test of stationarity

  • Kwiatkowski-Phillips-Schmidt-Shin test (KPSS test)
  • has built-in trend removal (option null = "trend")
kpss.test(TSP)

    KPSS Test for Level Stationarity

data:  TSP
KPSS Level = 2.0877, Truncation lag parameter = 4, p-value = 0.01

\(\rightarrow\) non-stationary

kpss.test(TSP, null = "Trend")

    KPSS Test for Trend Stationarity

data:  TSP
KPSS Trend = 0.10306, Truncation lag parameter = 4, p-value = 0.1

\(\rightarrow\) stationary after trend removal

KPSS test for a difference stationary process (DSP)


kpss.test(DSP)

    KPSS Test for Level Stationarity

data:  DSP
KPSS Level = 1.5869, Truncation lag parameter = 4, p-value = 0.01

\(\rightarrow\) non-stationary

kpss.test(DSP, null = "Trend")

    KPSS Test for Trend Stationarity

data:  DSP
KPSS Trend = 0.30063, Truncation lag parameter = 4, p-value = 0.01

\(\rightarrow\) trend removal
does not cure non-stationarity


Task: Check if a DSP series can be made stationary by differencing.

Trend Tests

Mann-Kendall trend test

  • nonparametric test
  • popular in environmental sciences
  • strictly suitable only for trend-stationary time series, robust in case of weak autocorrelation

Linear regression analysis

  • parametric test for linear trend
  • slope gives direct information about effect size
  • sensitive against autocorrelation

Other methods

  • Sen’s slope, Pettitt’s Test, Cox-Stuart Test, …

In general

  • trend tests are not adequate for “pure” difference-stationary time series, because residuals are autocorrelated
  • \(\Rightarrow\) test stationarity (or autocorrelation) before or after trend testing !!!

Mann-Kendall-Trend-Test


library("Kendall")
MannKendall(TSP)
tau = 0.906, 2-sided pvalue =< 2.22e-16

\(\rightarrow\) significant trend


MannKendall(DSP)
tau = 0.682, 2-sided pvalue =< 2.22e-16

\(\rightarrow\) indicates significant trend, but as process is DSP, interpretation is wrong.


  • check assumptions with correlogram and/or KPSS-test

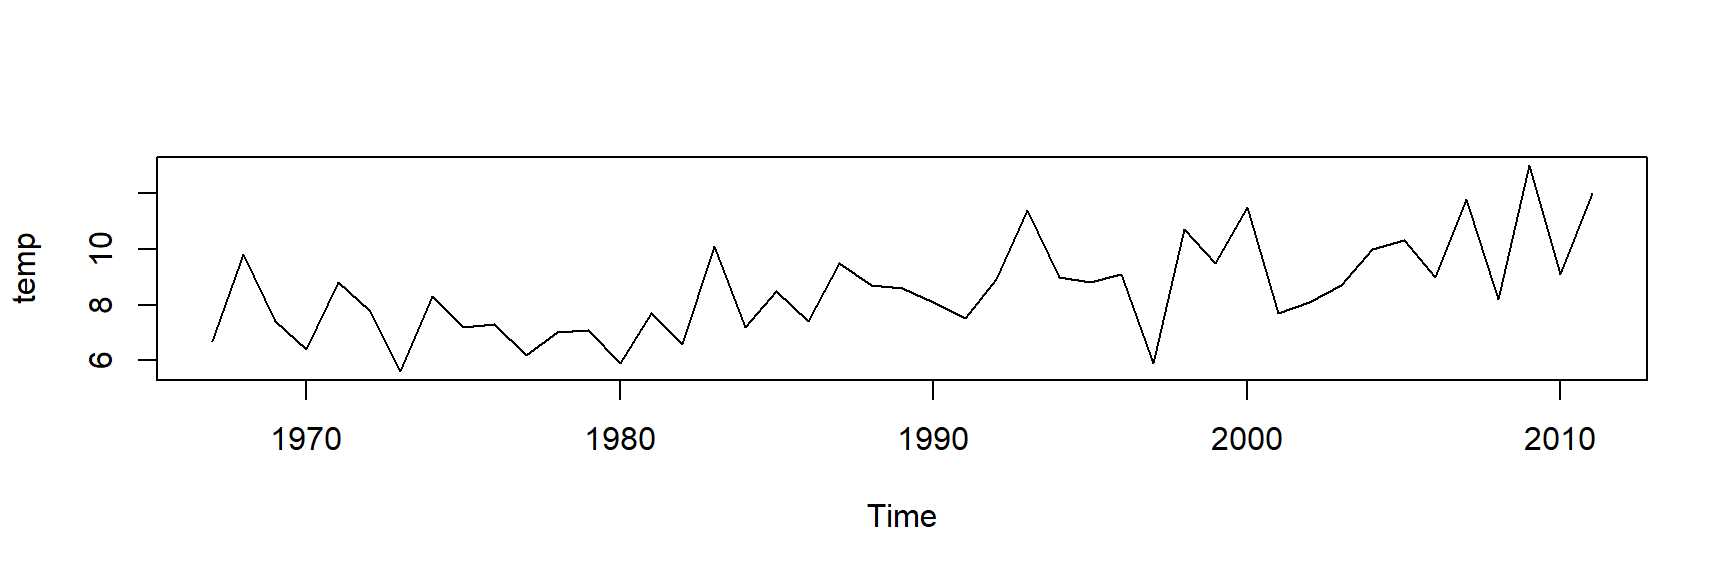
Application: trend of air temperature


temp <- read.csv("https://raw.githubusercontent.com/tpetzoldt/datasets/main/data/airtemp_april.csv")
temp <- ts(temp$T, start=temp$Year[1])
plot(temp)

Data: Air temperature in April, station Dresden-Klotsche (Germany), data source: Deutscher Wetterdienst (https://www.dwd.de), data aggregated and modified.

Stationarity and trend test


Check for stationarity

kpss.test(temp, null = "Trend")

    KPSS Test for Trend Stationarity

data:  temp
KPSS Trend = 0.097853, Truncation lag parameter = 3, p-value = 0.1


Mann-Kendall-Trend-test

library(Kendall)
MannKendall(temp)
tau = 0.449, 2-sided pvalue =1.5855e-05


  • KPSS test does not reject H0 of trend stationarity
  • Mann-Kendall is significant \(\rightarrow\) monotonous trend

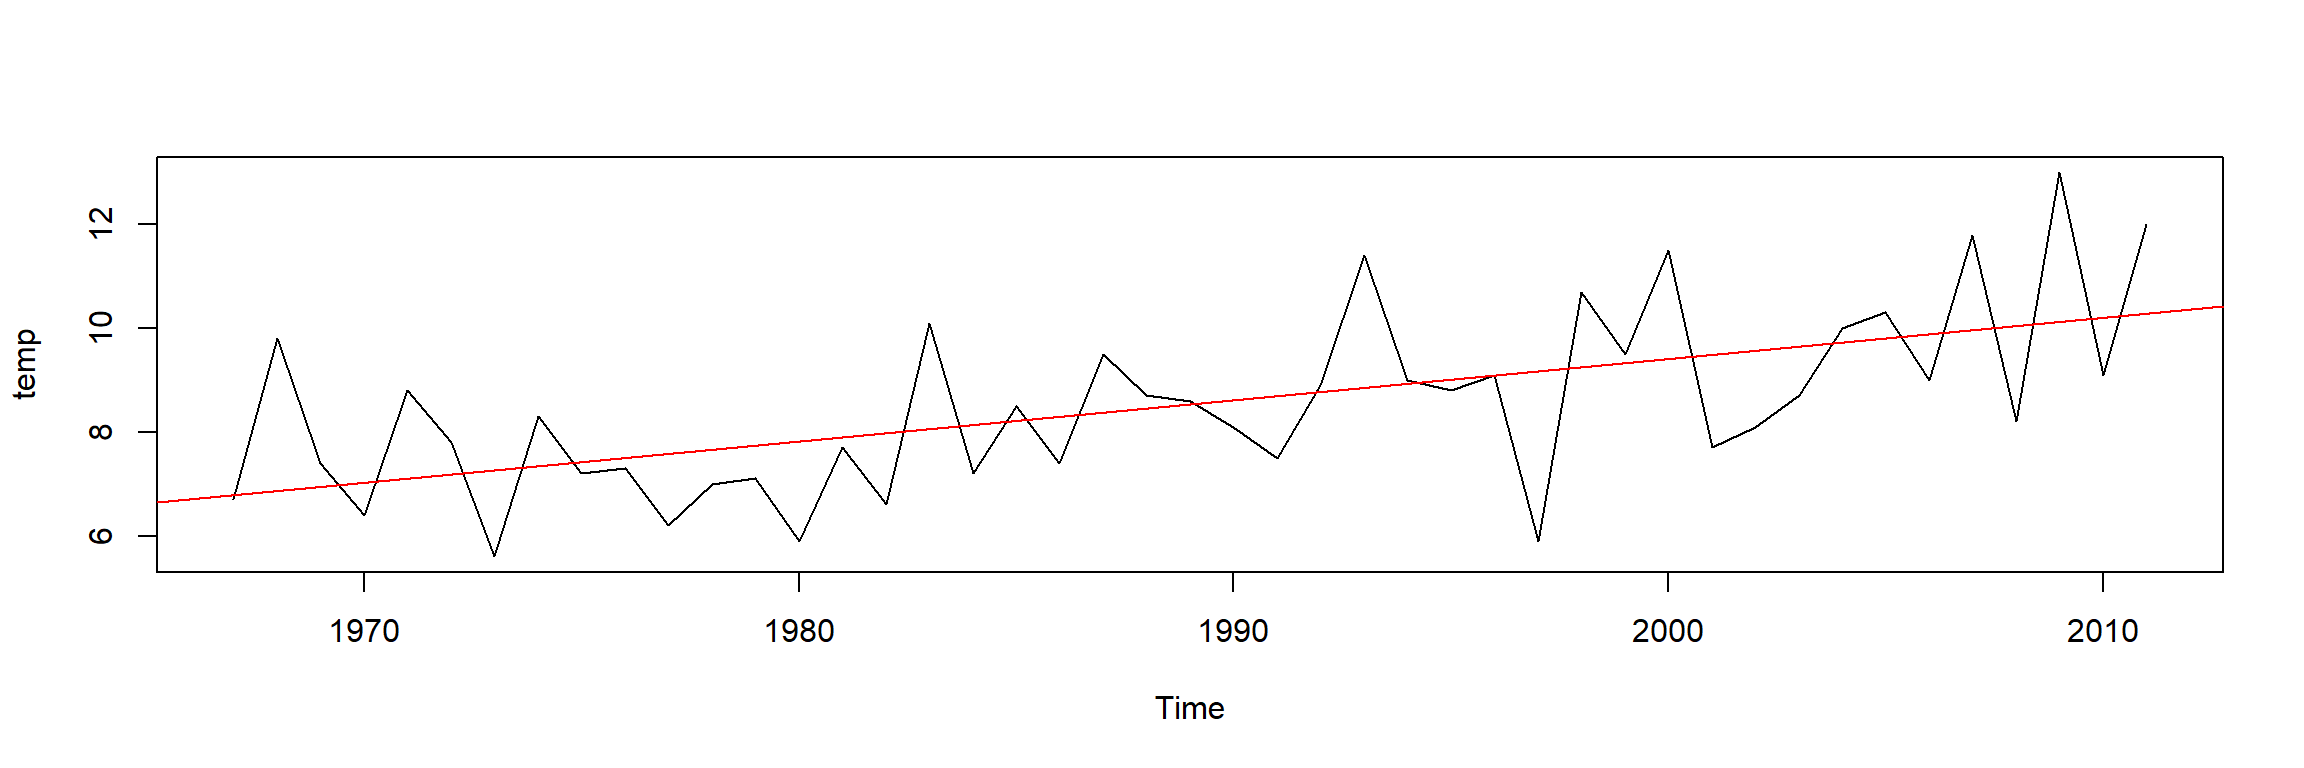
Linear trend

Show the code
plot(temp)
m <- lm(temp ~ time(temp))
abline(m, col="red")
summary(m)

Call:
lm(formula = temp ~ time(temp))

Residuals:
    Min      1Q  Median      3Q     Max 
-3.2733 -0.9369 -0.0816  0.6197  2.9386 

Coefficients:
              Estimate Std. Error t value Pr(>|t|)    
(Intercept) -150.03413   31.88781  -4.705 2.64e-05 ***
time(temp)     0.07972    0.01603   4.973 1.11e-05 ***
---
Signif. codes:  0 '***' 0.001 '**' 0.01 '*' 0.05 '.' 0.1 ' ' 1

Residual standard error: 1.397 on 43 degrees of freedom
Multiple R-squared:  0.3651,    Adjusted R-squared:  0.3504 
F-statistic: 24.73 on 1 and 43 DF,  p-value: 1.106e-05

Further reading


  • Kleiber & Zeileis (2008): a very practical book about econometrics with well understandable time series chapters

  • R. Shumway & Stoffer (2019): a book with a time series good introduction and good balance between mathematics and R programming

  • R. H. Shumway & Stoffer (2000): contains additional methods and more mathematical background

… and more in the labs and the homework project.

Appendix

A simulation experiment


Demonstration that application of a simple linear model to a difference stationary time series leads to an increase of false positives.


Tools

  • Define two functions to generate time series with specific properties:
genTSP <- function(time, beta0, beta1)
  as.ts(beta0 + beta1 * time + rnorm(time))

genDSP <- function(time, c) {
  DSP <- numeric(length(time))
  DSP[1] <- rnorm(1)
  for (tt in time[-1]) DSP[tt] <- DSP[tt-1] + c + rnorm(1)
  ts(DSP)
}

Count significant tests

count.signif <- function(N, time, FUN, ...) {
  a <- 0
  for (i in 1:N) {
    x <- FUN(time, ...)
    m <- summary(lm(x  ~ time(x)))
    f <- m$fstatistic
    p.value <- pf(f[1], f[2], f[3], lower=FALSE)
    # cat("p.value", p.value, "\n")
    if (p.value < 0.05) a <- a + 1
  }
  a
}

Run the experiment

  • count number of significant linear increase (using the F-value)
  • if trend parameters (beta1 an c) are set to zero, count.signif counts false positives
  • run loop 100 (or better: 1000) times for both types of time series
Nruns <- 100 
time  <- 1:100
count.signif(N=Nruns, time=time, FUN=genTSP, beta0=0, beta1=0) / Nruns
[1] 0.05
count.signif(N=Nruns, time=time, FUN=genDSP, c=0) / Nruns
[1] 0.91

Unit root test


  • Check whether a time series is of type “DSP”.
  • ADF-test (augmented Dickey-Fuller test), contained in R-package tseries.
  • Remember: A “TSP” can be made stationary by subtracting a trend.
    \(\rightarrow\) This is done automatically by the test.
  • Important: stationarity is the alternative hypothesis!


library(tseries)
adf.test(TSP)

    Augmented Dickey-Fuller Test

data:  TSP
Dickey-Fuller = -3.87, Lag order = 4, p-value = 0.01831
alternative hypothesis: stationary
adf.test(DSP)

    Augmented Dickey-Fuller Test

data:  DSP
Dickey-Fuller = -2.1883, Lag order = 4, p-value = 0.4986
alternative hypothesis: stationary

DSP: presence of a “unit root”


  • DSP series: presence of a unit root cannot be rejected,
  • \(\rightarrow\) non-stationary.
  • But, after differencing, there are no objections against stationarity:
adf.test(diff(DSP))

    Augmented Dickey-Fuller Test

data:  diff(DSP)
Dickey-Fuller = -3.62, Lag order = 4, p-value = 0.03504
alternative hypothesis: stationary

References


Horn, H., Horn, W., Paul, L., Uhlmann, D., & Röske, I. (2006). Drei Jahrzehnte kontinuierliche Untersuchungen an der Talsperre Saidenbach: Fakten, Zusammenhänge, Trends. Abschlussbericht zum Projekt "Langzeitstabilität der biologischen Struktur von Talsperren-Ökosystemen" der Arbeitsgruppe "Limnologie von Talsperren" der Sächsischen Akademie der Wissenschaften zu Leipzig (pp. 1–178). Verlag Dr. Uwe Miersch, Ossling.
Keeling, C. D., Piper, S. C., Bacastow, R. B., Wahlen, M., Whorf, T. P., Heimann, M., & Meijer, H. A. (2001). Exchanges of atmospheric CO2 and 13CO2 with the terrestrial biosphere and oceans from 1978 to 2000. I. Global aspects (p. 88). Scripps Institution of Oceanography, San Diego.
Kleiber, C., & Zeileis, A. (2008). Applied econometrics with R. Springer.
Kronenberg, F., R. (2021). Das regionale klimainformationssystem ReKIS – eine gemeinsame plattform für sachsen, sachsen-anhalt und thüringen. https://rekis.hydro.tu-dresden.de/
Paul, L., Horn, H., & W., H. (2020). Saidenbach reservoir in situ and Saidenbach reservoir inlets. Data packages 20, 23 and 177 from the IGB freshwater research and environmental database (FRED). Available according to the ODB CC-BY license. https://fred.igb-berlin.de
Shumway, R. H., & Stoffer, D. S. (2000). Time series analysis and its applications (Vol. 3). Springer.
Shumway, R., & Stoffer, D. (2019). Time series: A data analysis approach using r. CRC Press.
Tans, P., & Keeling, C. D. (2023). Trends in atmospheric carbon dioxide, Mauna Loa CO2 monthly mean data. NOAA Earth System Research Laboratories, Global Monitoring Laboratory. https://gml.noaa.gov/ccgg/trends/data.html