dnorm(x, mean = 0, sd = 1, log = FALSE)
pnorm(q, mean = 0, sd = 1, lower.tail = TRUE, log.p = FALSE)
qnorm(p, mean = 0, sd = 1, lower.tail = TRUE, log.p = FALSE)
rnorm(n, mean = 0, sd = 1)x3-Functions Everywhere
Angewandte Statistik – Ein Praxiskurs
2025-12-13
The ellipsis argument
plot(x, y, ...)- Some functions have a … argument, called “ellipsis”.
- This means that additional arguments are passed to other functions.
- Makes R flexible and extensible, but is sometimes tricky.
par(mfrow=c(1, 3))
x <- 1:10; y <- rnorm(10)
plot(x, y)
plot(x, y, type = "h")
plot(x, y, type = "s", col="red")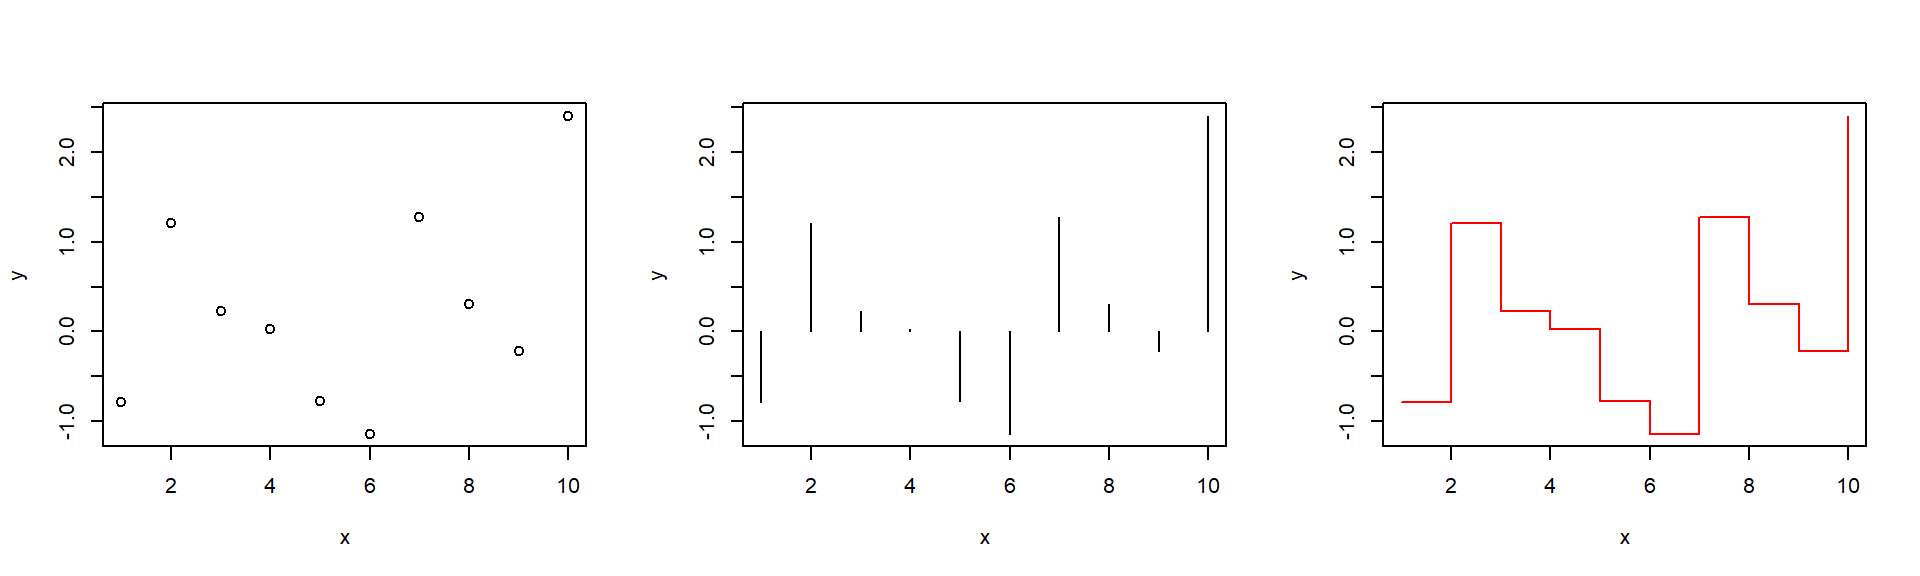
A user-defined Monod function
- describes substrate dependence of biochemical turnover
- widely used in biochemistry and in models
- e.g. organic matter turnover in wastewater treatment
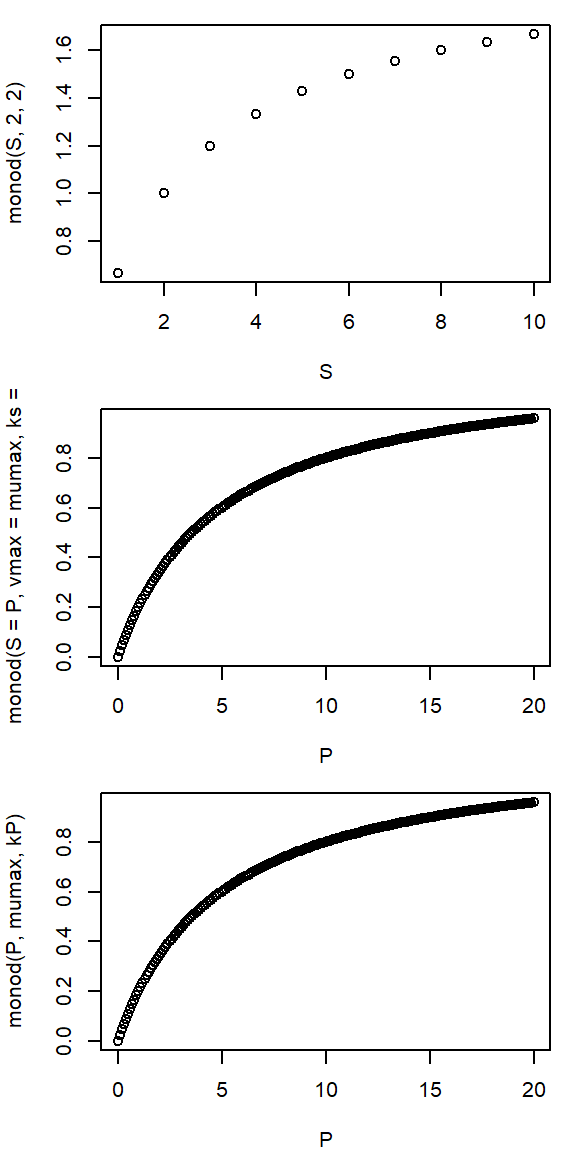
\[ v = \frac{v_{max} \cdot S}{k_S + S} \]
par(mar=c(4,4,1,1))
par(mfrow=c(3, 1))
monod <- function(S, vmax, ks) {
  vmax * S / (ks + S)
}


S <- 1:10
P <- seq(0, 20, 0.1)
kP <- 5; mumax <- 1.2;

## different ways to call the function
plot(S, monod(S, 2, 2))                # simple call
plot(P, monod(S=P, vmax=mumax, ks=kP)) # named arguments
plot(P, monod(P, mumax, kP)) # argument position- names of caller and function can be different
Seasonal Light Intensity in Dresden
\[ I_t = 997 - 816 \cos(2 \pi t / 365) + 126 \sin(2 \pi t / 365) \]
Functions as a knowledge base
- put knowledge in function and use it
- forget what is inside
rad <- function(t) {
  ## fill equation in
}

t <- 1:365
plot(t, rad(t), type = "l")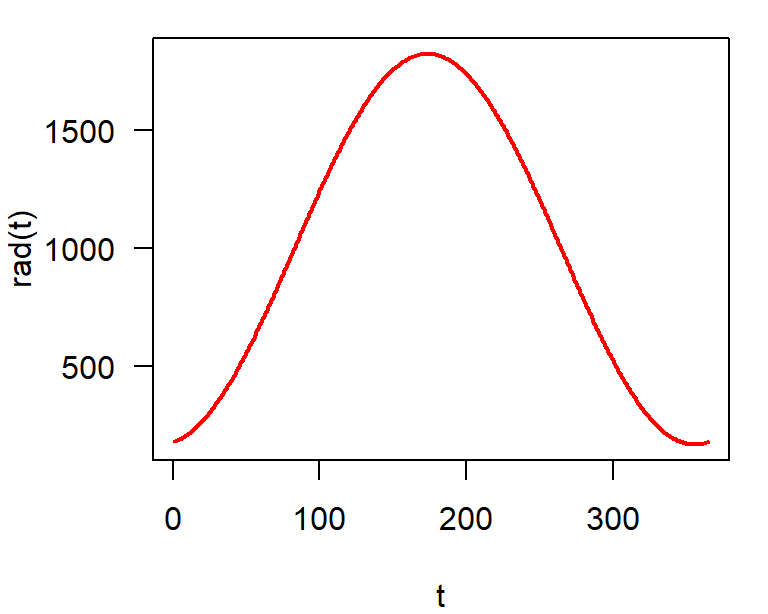
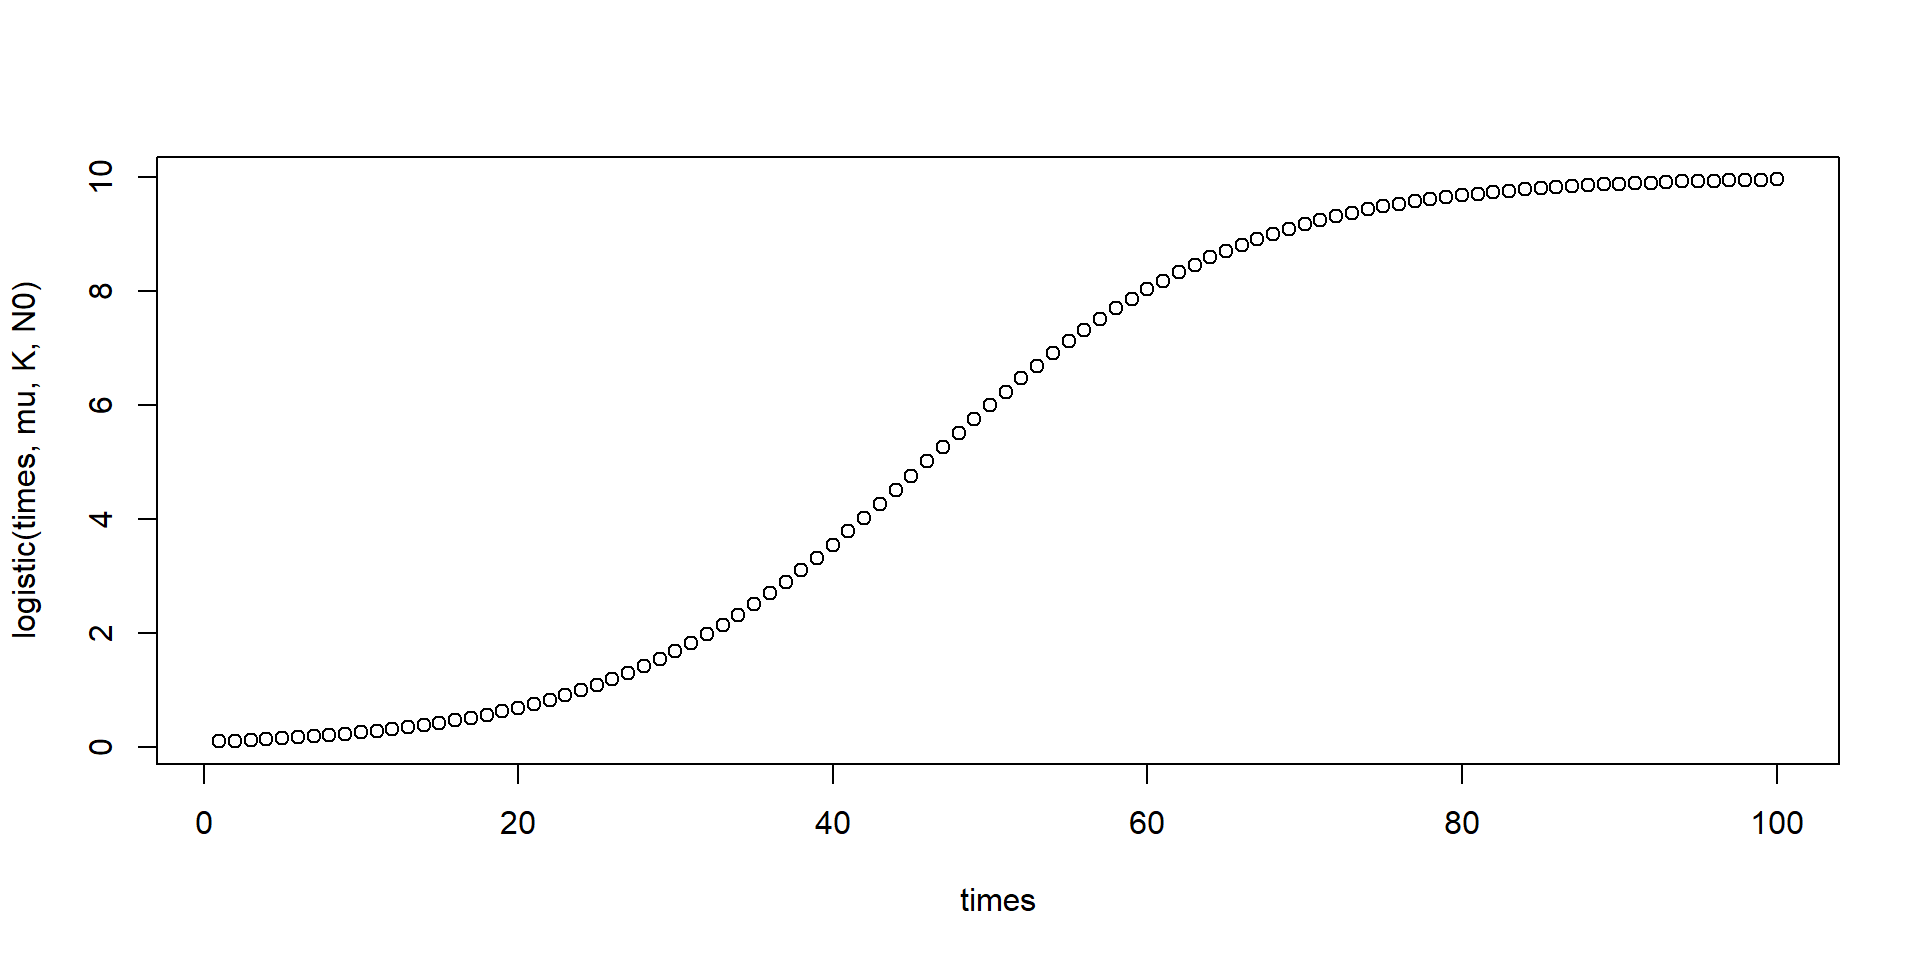
plot(times,
     logistic(times, mu, K, N0))